A
B
C
D
Text Solution
Verified by Experts
The correct Answer is:


Topper's Solved these Questions
SOLVD PAPERS 2017 NEET, AIIMS & JIPMER
DC PANDEY ENGLISH|Exercise Solved paper 2018(NEET)|22 VideosSOLVD PAPERS 2017 NEET, AIIMS & JIPMER
DC PANDEY ENGLISH|Exercise Solved paper 2018(AIIMS)|28 VideosSOLVD PAPERS 2017 NEET, AIIMS & JIPMER
DC PANDEY ENGLISH|Exercise Solved Papers 2017(AIIMS)|26 VideosSIMPLE HARMONIC MOTION
DC PANDEY ENGLISH|Exercise Integer type questions|14 VideosSOUND WAVES
DC PANDEY ENGLISH|Exercise Exercise 19.7|4 Videos
Similar Questions
Explore conceptually related problems
DC PANDEY ENGLISH-SOLVD PAPERS 2017 NEET, AIIMS & JIPMER-Solved Papers 2017(JIPMER)
- A skier starts from rest at point A and slides donw the hill without t...
Text Solution
|
- A bicycle wheel rolls without slipping on a horizonatal floor.W hich o...
Text Solution
|
- The planets with radii R(1) and R(2) have densities p(1),p(2) respect...
Text Solution
|
- A wide hose pipe is held horizontally by fireman.It delivers water thr...
Text Solution
|
- The upper half of an inclined plane with inclination phi is perfectly ...
Text Solution
|
- The masses of 10 kg and 20 kg respectively are connected by a massless...
Text Solution
|
- A cylinder rolls up an inclined plane, reaches some height, and then r...
Text Solution
|
- A liquid is allowed to flow into a tube of truncated cone shape. Ident...
Text Solution
|
- Two soap bubbles coalesce.It noticed that, whilst joined together, the...
Text Solution
|
- The displacement of a particle along the x-axis is given by x = a sin^...
Text Solution
|
- Mercury boils at 367^(@)C. However, mercury thermometers are made such...
Text Solution
|
- Two identical glass spheres filled with air are connected by a thin ho...
Text Solution
|
- a graph between prssure P (along y-axis) and absolute temperature, T(a...
Text Solution
|
- A piece of blue glass heated to a high temperature and a piece of red ...
Text Solution
|
- A long block A of mass M is at rest on a smooth horizontal surface.A s...
Text Solution
|
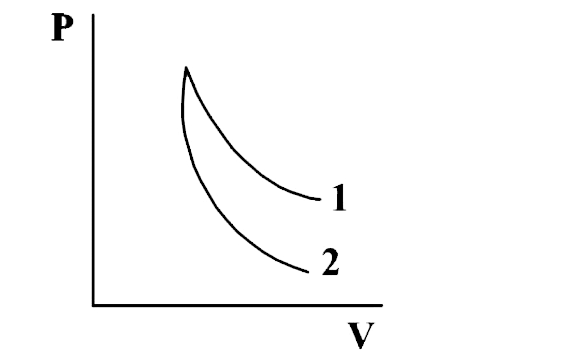
- P-V plots for two gases during adiabatic processes are shown in the fi...
Text Solution
|
- A uniform rod of length L is free to rotate in a vertical plane about ...
Text Solution
|
- A Stick of length L and mass M lies on a fnctionless horizontal surfac...
Text Solution
|
- An iceberg of density 900kg//m^(3) is floating in water of density 100...
Text Solution
|
- A scientist says that the efficiency of his heat engine which operates...
Text Solution
|