Text Solution
Verified by Experts
The correct Answer is:


Topper's Solved these Questions
MOTION IN A PLANE
DC PANDEY ENGLISH|Exercise (C )Medical entrances gallery|32 VideosMOTION IN A PLANE
DC PANDEY ENGLISH|Exercise (B) Meical entrance special format questions (Assertion and reason)|19 VideosMOTION
DC PANDEY ENGLISH|Exercise Medical entrances gallery|19 VideosPROJECTILE MOTION
DC PANDEY ENGLISH|Exercise Level - 2 Subjective|10 Videos
Similar Questions
Explore conceptually related problems
DC PANDEY ENGLISH-MOTION IN A PLANE-(B) Meical entrance special format questions (Mathch the columns)
- Match the following columns. |{:(,"Column I",,"Column II"),((A),"d ...
Text Solution
|
- In the s-t equation (s=10+20 t-5t^(2)) match the following columns. ...
Text Solution
|
- Velocity of a particle is in negative direction with constant accelera...
Text Solution
|
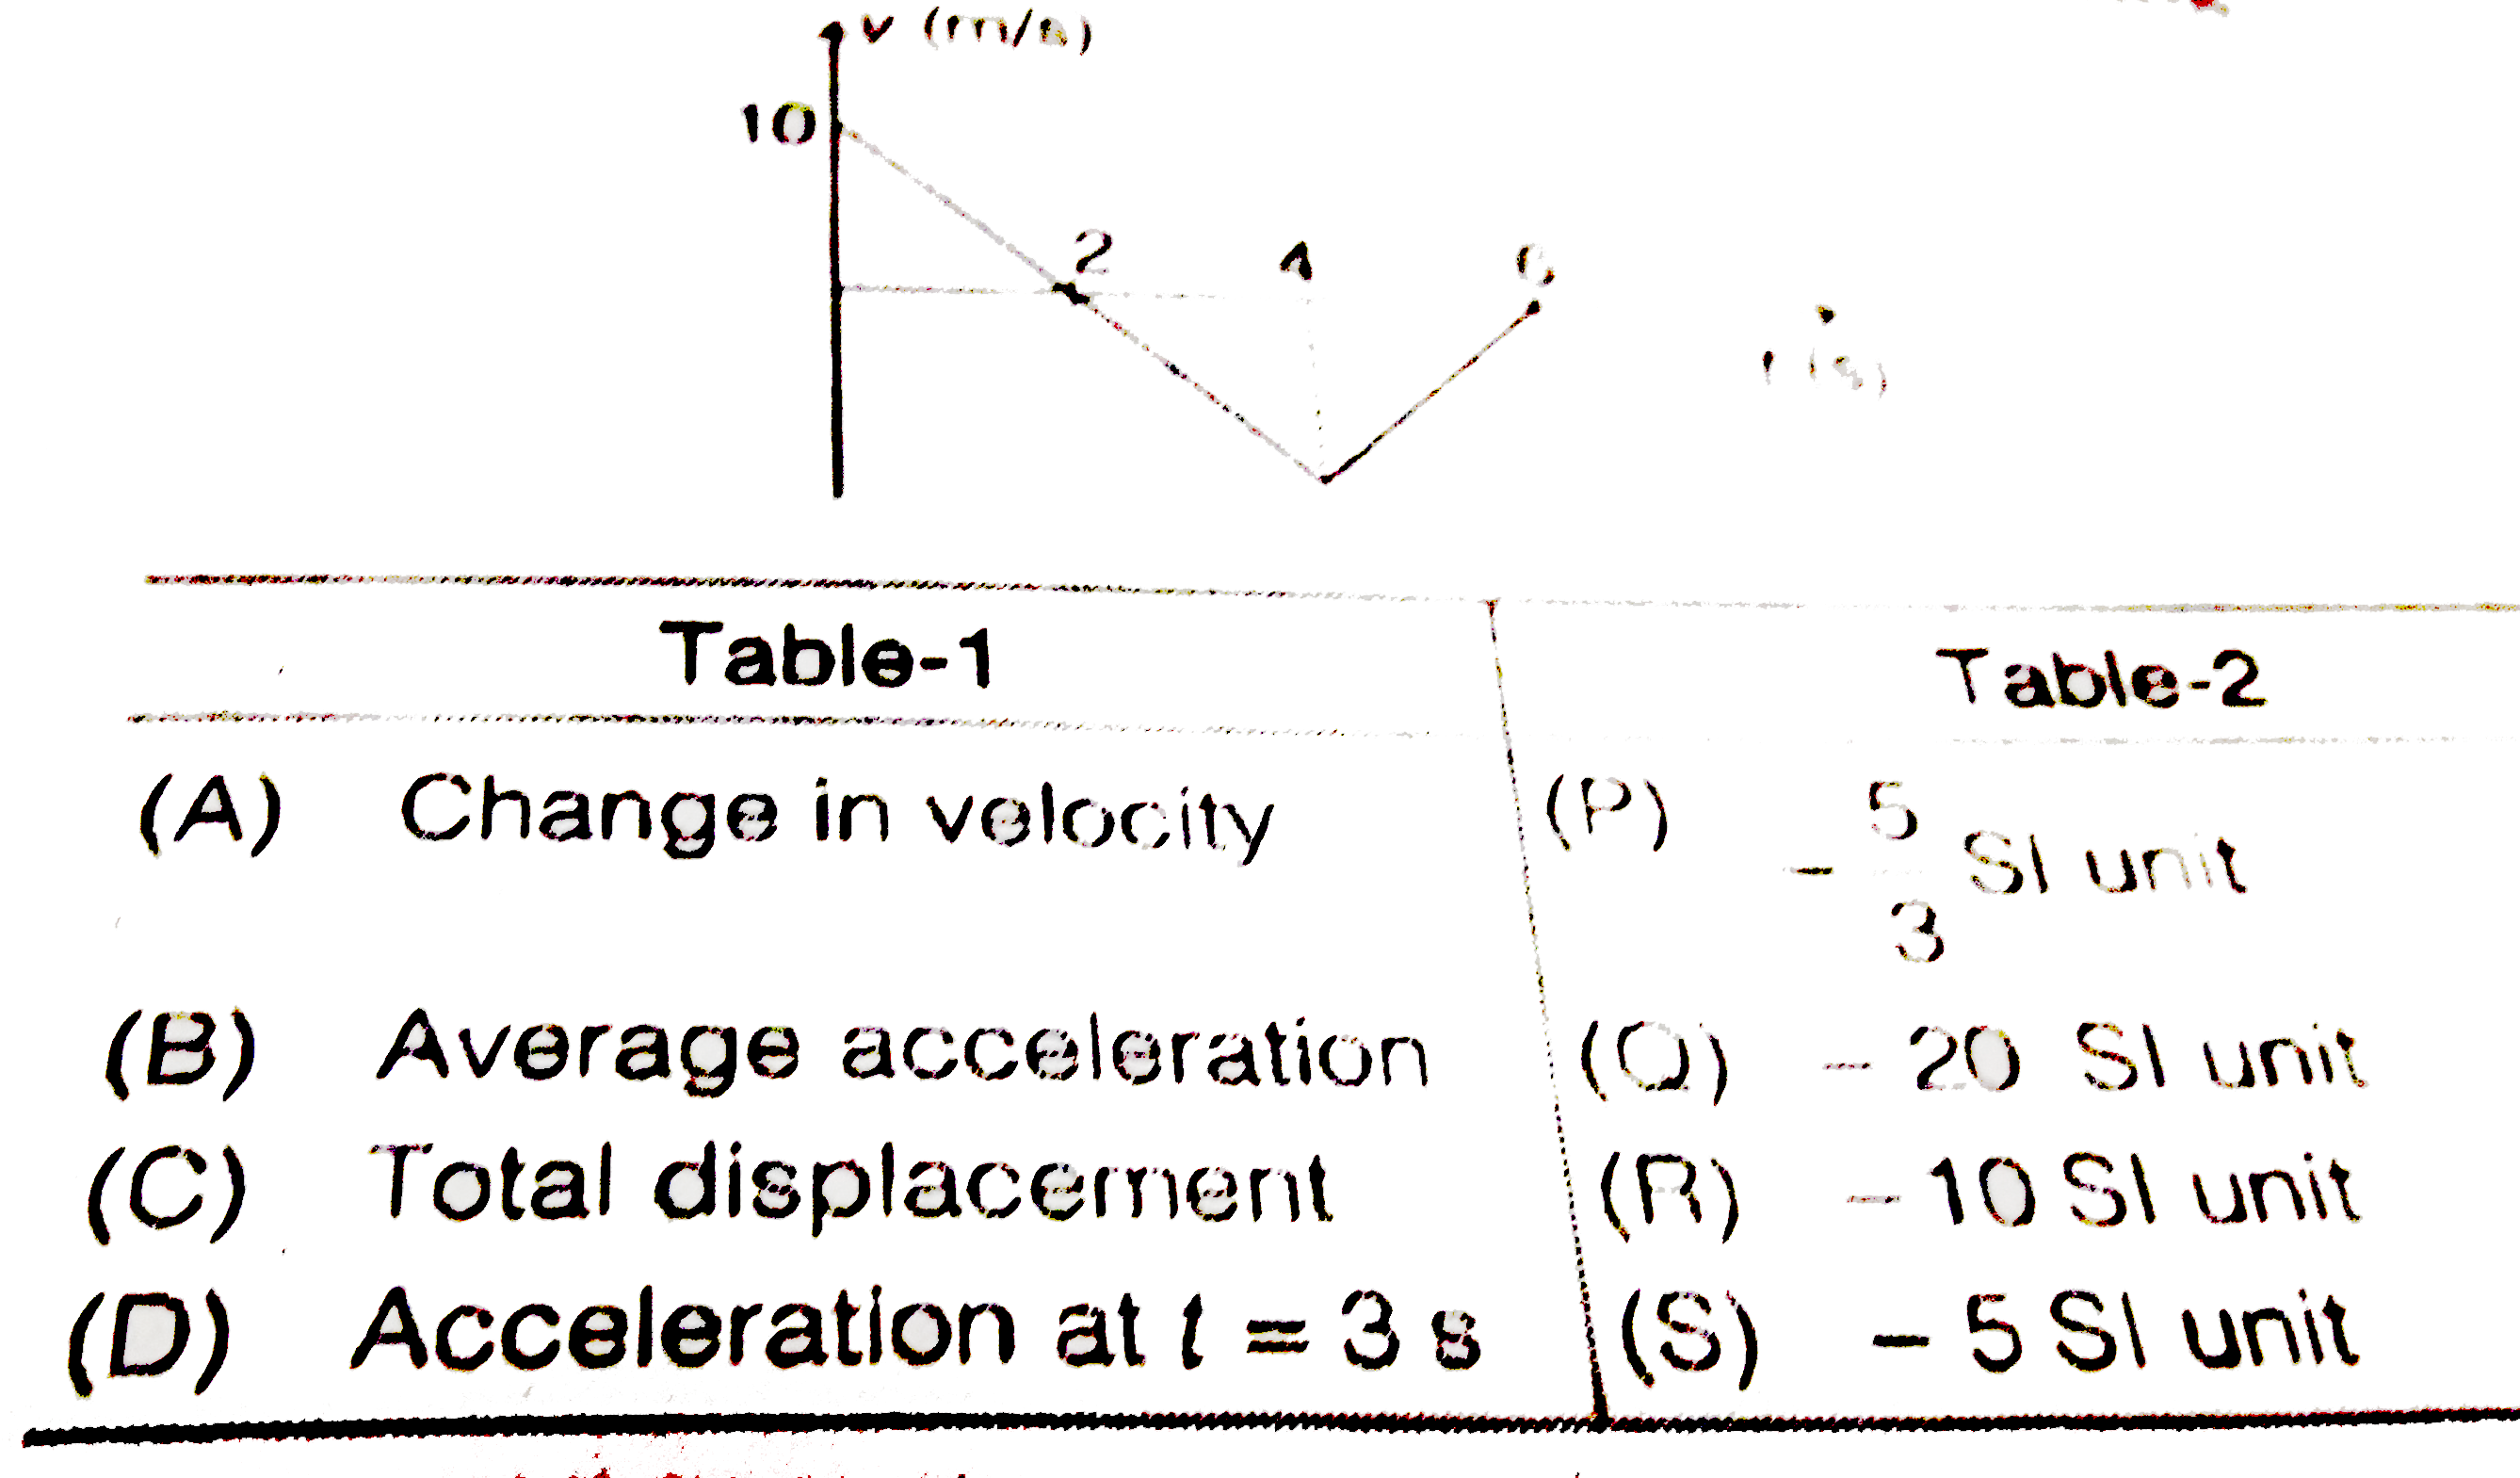
- Match the following columns. |{:(,"Column I",,"Column II"),((A),"Con...
Text Solution
|
- For the velocity time graph shown in figure, in a time interval from t...
Text Solution
|
- Let us call a motion, A when velocity is positive and increasing A^(-1...
Text Solution
|