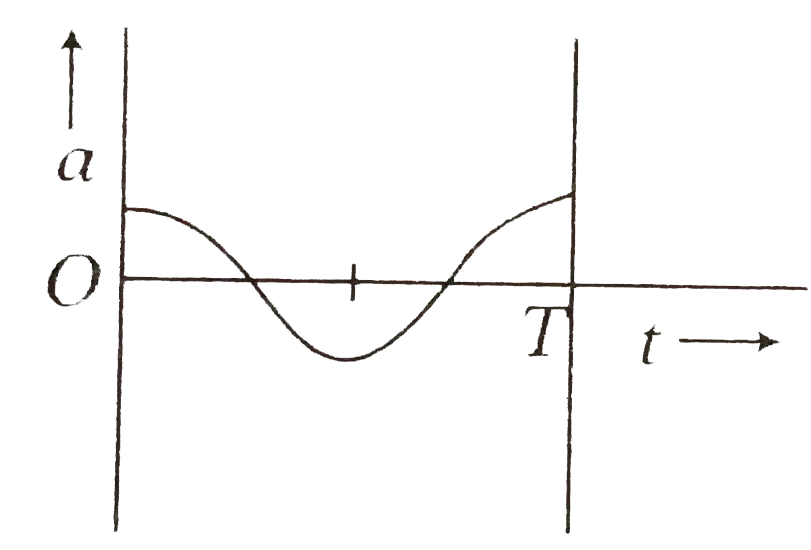
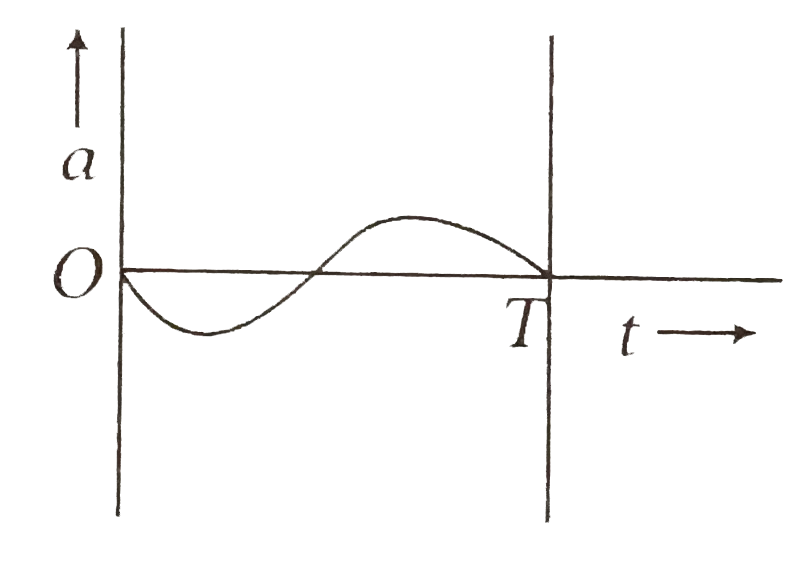
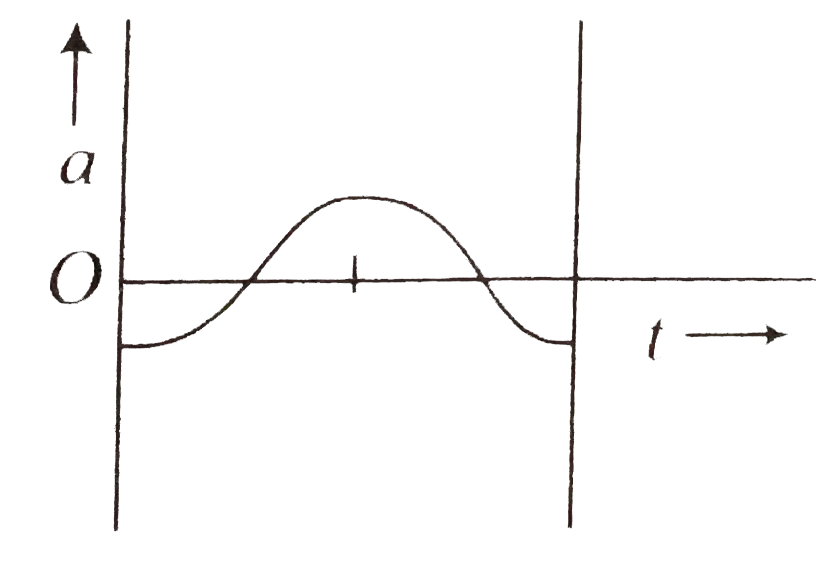
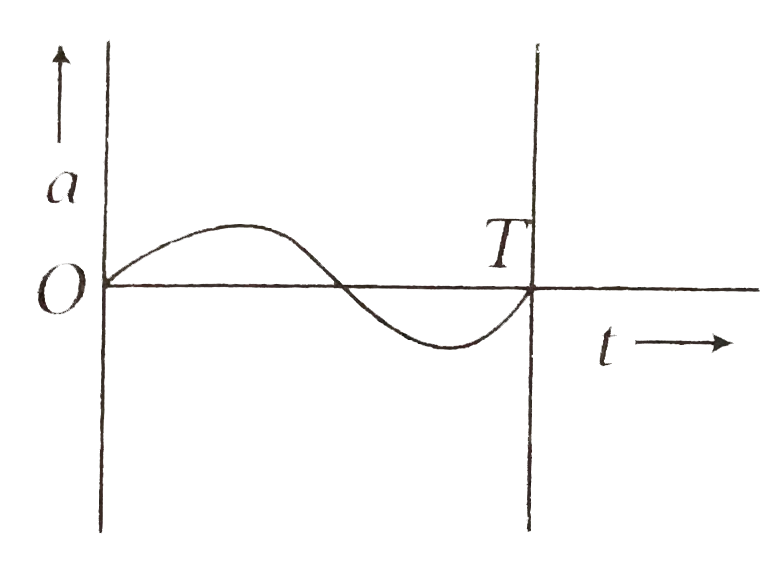
Home
Class 11
PHYSICS
The oscillation of a body on a smooth ho...

The oscillation of a body on a smooth horizental surface is respresented by the equation
`X = A cos (omegat)`
where one of the following graph shown correctly the variation a with `t`?

A

B

C

D

Text Solution

AI Generated Solution

The correct Answer is:
To solve the problem, we need to analyze the given displacement equation and derive the acceleration from it. Here’s a step-by-step breakdown: ### Step 1: Understand the Displacement Equation The displacement of the body is given by the equation: \[ x = A \cos(\omega t) \] where: - \( x \) is the displacement, - \( A \) is the amplitude, - \( \omega \) is the angular frequency, - \( t \) is the time. ### Step 2: Find the Velocity The velocity \( v \) is the rate of change of displacement with respect to time. We can find it by differentiating the displacement equation with respect to \( t \): \[ v = \frac{dx}{dt} = -A \omega \sin(\omega t) \] ### Step 3: Find the Acceleration The acceleration \( a \) is the rate of change of velocity with respect to time. We can find it by differentiating the velocity equation: \[ a = \frac{dv}{dt} = -A \omega^2 \cos(\omega t) \] ### Step 4: Analyze the Acceleration Equation The acceleration equation is: \[ a = -A \omega^2 \cos(\omega t) \] This indicates that the acceleration is proportional to the cosine function, but with a negative sign. ### Step 5: Graph the Acceleration The graph of \( -\cos(\omega t) \) will start at its maximum negative value when \( t = 0 \) (since \( \cos(0) = 1 \)), and it will oscillate between \( -A \omega^2 \) and \( A \omega^2 \). The graph will have the following characteristics: - It will be a cosine wave. - It will be inverted (negative cosine). ### Step 6: Identify the Correct Graph From the options provided, we need to identify the graph that represents the negative cosine function. The correct graph will start at the lowest point (minimum value) and will oscillate upwards and downwards, matching the behavior of \( -\cos(\omega t) \). ### Conclusion The correct option that represents the variation of acceleration with time is the one that shows a negative cosine wave. ---

To solve the problem, we need to analyze the given displacement equation and derive the acceleration from it. Here’s a step-by-step breakdown: ### Step 1: Understand the Displacement Equation The displacement of the body is given by the equation: \[ x = A \cos(\omega t) \] where: - \( x \) is the displacement, - \( A \) is the amplitude, ...
Promotional Banner

Similar Questions

Explore conceptually related problems

The graph represented by the equations x= sin ^(2) t, y = 2 cos t is

A body is thrown vertically upwards. Which one of the following graphs correctly represent the velocity vs time?

The velocity -displacement graph of a particle is as shown in the figure. Which of the following graphs correctly represents the variation of acceleration with displacement?

An alternating current I in an inductance coil varies with time t according to the graph as shown: Which one of the following graph gives the variation of voltage with time?

An alternating current I in an inductance coil varies with time t according to the graph as shown: Which one of the following graph gives the variation of voltage with time?

A bob of mass m is connected by string of length L to point P. The system is released from rest with the pendulum bob in a horizontal position. Which of the following graph is correctly showing the variation of T (tension) with Ɵ?

Switch S of the circuit shows in Fig. is closed at t = 0 . If e denotes the induced emf in L and i the current flowing through the circuit at time t , then which of the following graphs correctly represents the variation of e with i ?

The velocity v of a particle moving along x - axis varies with ist position (x) as v=alpha sqrtx , where alpha is a constant. Which of the following graph represents the variation of its acceleration (a) with time (t)?

The displacement x of a body of mass 1 kg on a horizontal smooth surface as a function of time t is given by x = (t^4)/4 . The work done in the first second is

The graph shown the variation with times t of the velocity v of an object . Which one of the following graphs best represents the variation of acceleration a of the object with time t ?