A
B
C
D
Text Solution
Verified by Experts
The correct Answer is:


Topper's Solved these Questions
ELASTICITY
DC PANDEY ENGLISH|Exercise Match the columns|4 VideosELASTICITY
DC PANDEY ENGLISH|Exercise Medical entrances s gallery|21 VideosELASTICITY
DC PANDEY ENGLISH|Exercise Check point 12.3|15 VideosCURRENT ELECTRICITY
DC PANDEY ENGLISH|Exercise All Questions|469 VideosELECTROSTATICS
DC PANDEY ENGLISH|Exercise Integer|17 Videos
Similar Questions
Explore conceptually related problems
DC PANDEY ENGLISH-ELASTICITY-Chapter Exercise
- A load suspended by a massless spring produces an extention of xcm in ...
Text Solution
|
- A steal wire of cross-section area 3xx10^(-6) m^(2) can withstand a m...
Text Solution
|
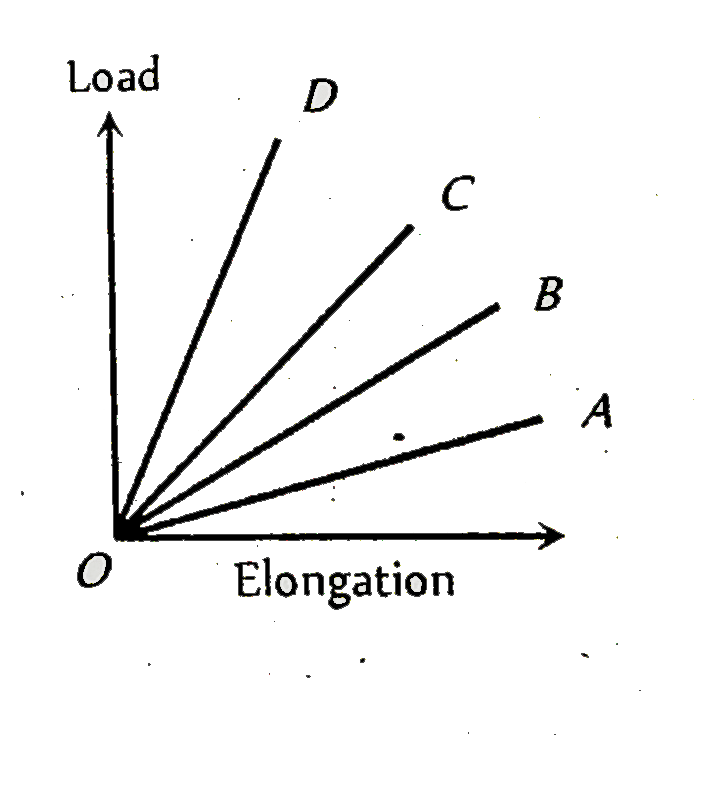
- The load versus elongation graph for four wires of the same material i...
Text Solution
|
- Two wires of the same material and length but diameter in the ratic 1:...
Text Solution
|
- A stress of 10^(6) N//m^(2) is required for breaking a material. If t...
Text Solution
|
- A cable is replaced by another cable of the same length and material b...
Text Solution
|
- A uniform steel rod of cross- sectional area A and L is suspended so t...
Text Solution
|
- A rubber pipe of density 1.5 xx 10^(3) N//m^(2) and Young's modulus 5 ...
Text Solution
|
- In the given figure, if the dimensions of the two wires are same but m...
Text Solution
|
- The stress versus strain graphs for wires of two materials A and B are...
Text Solution
|
- An elevator cable is to have a maximum stress of 7xx10^(7) Nm^(-2) to ...
Text Solution
|
- The following four wires are made of same material. Which of these wil...
Text Solution
|
- A copper wire (Y=10^(11) Nm^(-2)) of length 8 m and a steel wire (Y=2x...
Text Solution
|
- The strain stress curves of three wires of different materials are sho...
Text Solution
|
- A string 1m long is drawn by a 300 Hz vibrator attached to its end. Th...
Text Solution
|
- The potential energy U between two molecules as a function of the dist...
Text Solution
|
- The diagram shows a force-extension graph for a rubber band. Conside...
Text Solution
|
- Consider two cylindrical rods of identical dimensions, one of rubbe...
Text Solution
|
- The adjacent graph shows the extension Deltal of a wire of length 1m...
Text Solution
|
- A brass of length 2 m and cross-sectional area 2.0 cm^(2) is attached ...
Text Solution
|