Home
Class 11
PHYSICS
The p-T graph for the given mass of an i...

The `p-T` graph for the given mass of an ideal gas is shown in figure. What inference can be drawn regarding the change in Volume (whtherit is constant, increasing or decreasing) ?

Text Solution

Verified by Experts

Form th given graph we can write the `p-T` equation as,
`" " p/T=a+b/T`
now, `" " T_(B)gtT_(A)`
`therefore" " b/T_(B)ltb/T_(A)`
or `" " (p/T)_(B)lt(p/T)_(A)`
or `" " (T/p)_(B)gt(p/T)_(A)`
or `" " V_(B)gtV_(A)`
Thus, us we move from A to B, volume of the is increasing.
Promotional Banner

Topper's Solved these Questions

  • THERMOMETRY THERMAL EXPANSION AND KINETIC THEORY OF GASES

    DC PANDEY ENGLISH|Exercise Check point 14.1|10 Videos
  • THERMOMETRY THERMAL EXPANSION AND KINETIC THEORY OF GASES

    DC PANDEY ENGLISH|Exercise Check point 14.2|20 Videos
  • SUPERPOSITION OF WAVES

    DC PANDEY ENGLISH|Exercise Level 2 Subjective|8 Videos
  • THERMOMETRY,THERMAL EXPANSION & KINETIC THEORY OF GASES

    DC PANDEY ENGLISH|Exercise Level 2 Subjective|9 Videos

Similar Questions

Explore conceptually related problems

The p-T graph for the given mass of an ideal gas is shown in figure. What inference can be drawn regarding the change in volume (whether it is constant, increasing or decreasing) ? How to proceed Definitely, it is not constant. Because when volume of the gas is constant p-T graph is a straight line passing through origin. The given line does not pass through origin, hence volume is not constant. . V = (nR)((T)/P) Now, to see volume of the gas we will have to see whether (T)/(P) is increasing or decreasing.

The graph of pressure and temperature for an ideal gas is as shown in figure. The given process is

Volume versus temperature graphs for a given mass of an ideal gas are shown in figure. At two different values of constant pressure. What can be inferred about relation between P_(1) and P_(2) ?

Volume versus temperature graphs for a given mass of an ideal gas are shown in figure. At two different values of constant pressure. What can be inferred about relation between P_(1) and P_(2) ?

Volume versus temperature graphs for a given mass of an ideal gas are shown in figure. At two different values of constant pressure. What can be inferred about relation between P_(1) and P_(2) ?

The three diagrams below depict three different processes for a given mass of an ideal gas. What information can be drawn regarding the change of (a) pressure, (b) volume and (c ) temperature of the gas from the plots as shown in Fig., respectively.

The volume-temperature graphs of a given mass of an ideal gas at constant pressure are shown below. What is the correct order of pressure ?

P-T graph for same number of moles of two ideal gases are shown . Find the path along which volume decreases .

The pressure of a given mass of a gas contained in a vessel at constant temperature is reduced to half. Calculte the change in volume of the gas

From the p-T graph what conclusion can be drawn?

DC PANDEY ENGLISH-THERMOMETRY THERMAL EXPANSION AND KINETIC THEORY OF GASES-Medical entrance gallary
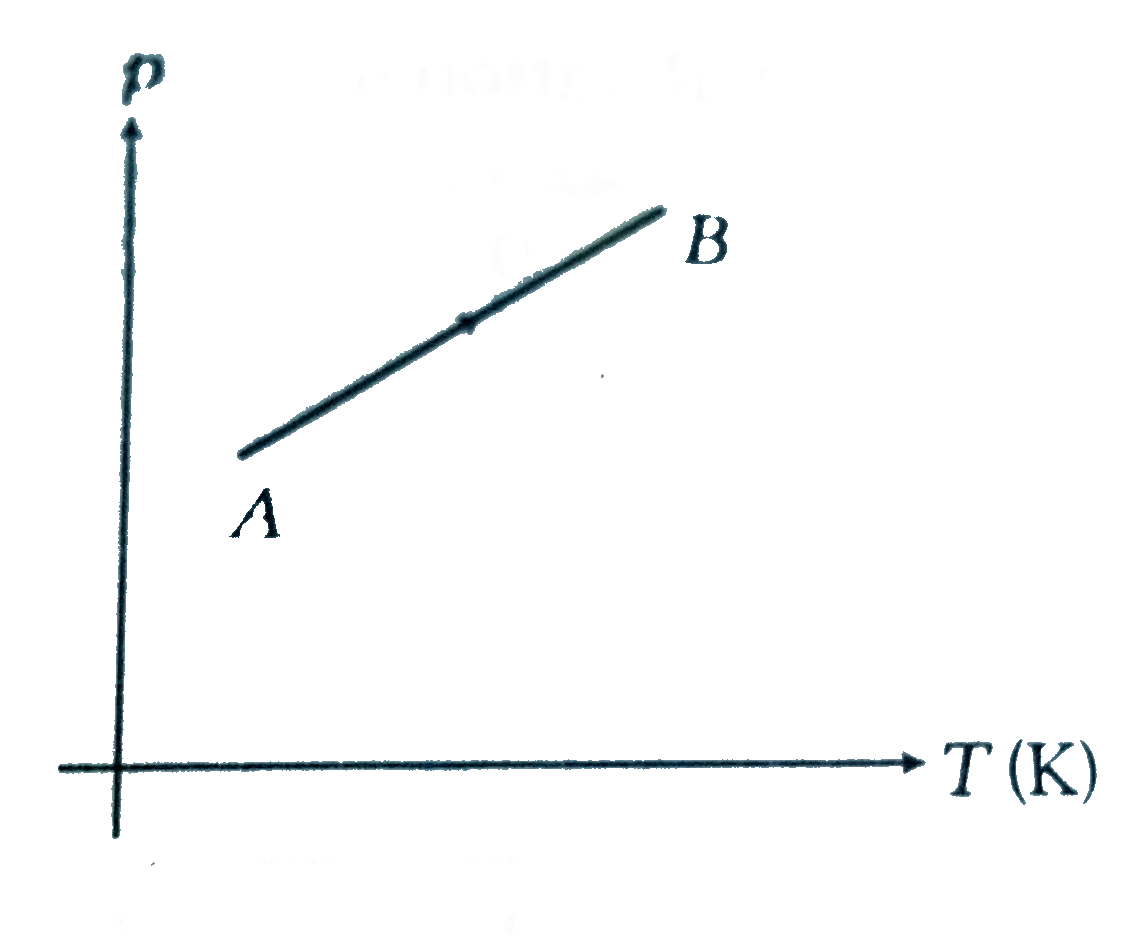
  1. The p-T graph for the given mass of an ideal gas is shown in figure. W...

    Text Solution

    |

  2. A sample of an ideal gas occupies a volume V at pressure P and absolut...

    Text Solution

    |

  3. Two rods, one of aluminum and the other made of steel, having initial ...

    Text Solution

    |

  4. The molecules of a given mass of a gas have rms velocity of 200 m/s a...

    Text Solution

    |

  5. The rms speed of oxygen molecule in a gas at 27^(@)C would be given by

    Text Solution

    |

  6. The pressure of an ideal gas is directly proportional to

    Text Solution

    |

  7. Two different wires having lengths L(1) and L(2) and respective t...

    Text Solution

    |

  8. The ratio of rms speed of an ideal gas molecules at pressure p to that...

    Text Solution

    |

  9. The rms speed of oxygen molecules in a gas in a gas is v. If the tempe...

    Text Solution

    |

  10. The deviation of a real gas from the ideal one is minimum at

    Text Solution

    |

  11. (a) Calculate (i) root-mean-square speed and (ii) the mean energy of 1...

    Text Solution

    |

  12. The value of coefficient of volume expansion of glycerin is 5 xx 10^(-...

    Text Solution

    |

  13. Pressure remaining the constant, the volume of a given mass of an idea...

    Text Solution

    |

  14. When water is heated from 0^(@)C to 10^(@)C , its volume

    Text Solution

    |

  15. The length of s steel rod exceeds that of a brass rod by 5 cm. If the ...

    Text Solution

    |

  16. The density of water is maximum at:

    Text Solution

    |

  17. A metal rod if fixed rigidly at two ends so as to prevent its thermal ...

    Text Solution

    |

  18. Which one of the following is a wrong statement in kinetic theory of g...

    Text Solution

    |

  19. The mean free path of molecules of a gas (radius r) is inversely propo...

    Text Solution

    |

  20. Prove that the pressure of an ideal gas is numerically equal to two th...

    Text Solution

    |

  21. According to equipartition law of energy each particle in a system of ...

    Text Solution

    |