A
B
C
D
Text Solution
Verified by Experts
The correct Answer is:


Topper's Solved these Questions
THERMOMETRY THERMAL EXPANSION AND KINETIC THEORY OF GASES
DC PANDEY ENGLISH|Exercise B medical entrance special format questions|14 VideosTHERMOMETRY THERMAL EXPANSION AND KINETIC THEORY OF GASES
DC PANDEY ENGLISH|Exercise Match the columns|5 VideosTHERMOMETRY THERMAL EXPANSION AND KINETIC THEORY OF GASES
DC PANDEY ENGLISH|Exercise Check point 14.4|25 VideosSUPERPOSITION OF WAVES
DC PANDEY ENGLISH|Exercise Level 2 Subjective|8 VideosTHERMOMETRY,THERMAL EXPANSION & KINETIC THEORY OF GASES
DC PANDEY ENGLISH|Exercise Level 2 Subjective|9 Videos
Similar Questions
Explore conceptually related problems
DC PANDEY ENGLISH-THERMOMETRY THERMAL EXPANSION AND KINETIC THEORY OF GASES-A Tacking it together
- The root mean square velocity of the molecules in a sample of helium i...
Text Solution
|
- At room temperature, the rms speed of the molecules of a certain diato...
Text Solution
|
- A ring shaped tube contain two ideal gases with equal masses and mola...
Text Solution
|
- Figure shows two flasks connected to each other. The volume of flask 1...
Text Solution
|
- 1 mole of an ideal gas is contained in a cubical volume V, ABCDEFGH at...
Text Solution
|
- A cyclic process 1-2-3-4-1 is depicted on V-T diagram. The p-T and p-V...
Text Solution
|
- A cyclic process ABCD is shown in the p-V diagram. Which of the follow...
Text Solution
|
- Find the average kinetic energy per molecule at temperature T for an e...
Text Solution
|
- The p-T graph for the given mass of an ideal gas is shown in figure. W...
Text Solution
|
- A sphere of diameter 7.0 cm and mass 266.5 g float in a bath of liquid...
Text Solution
|
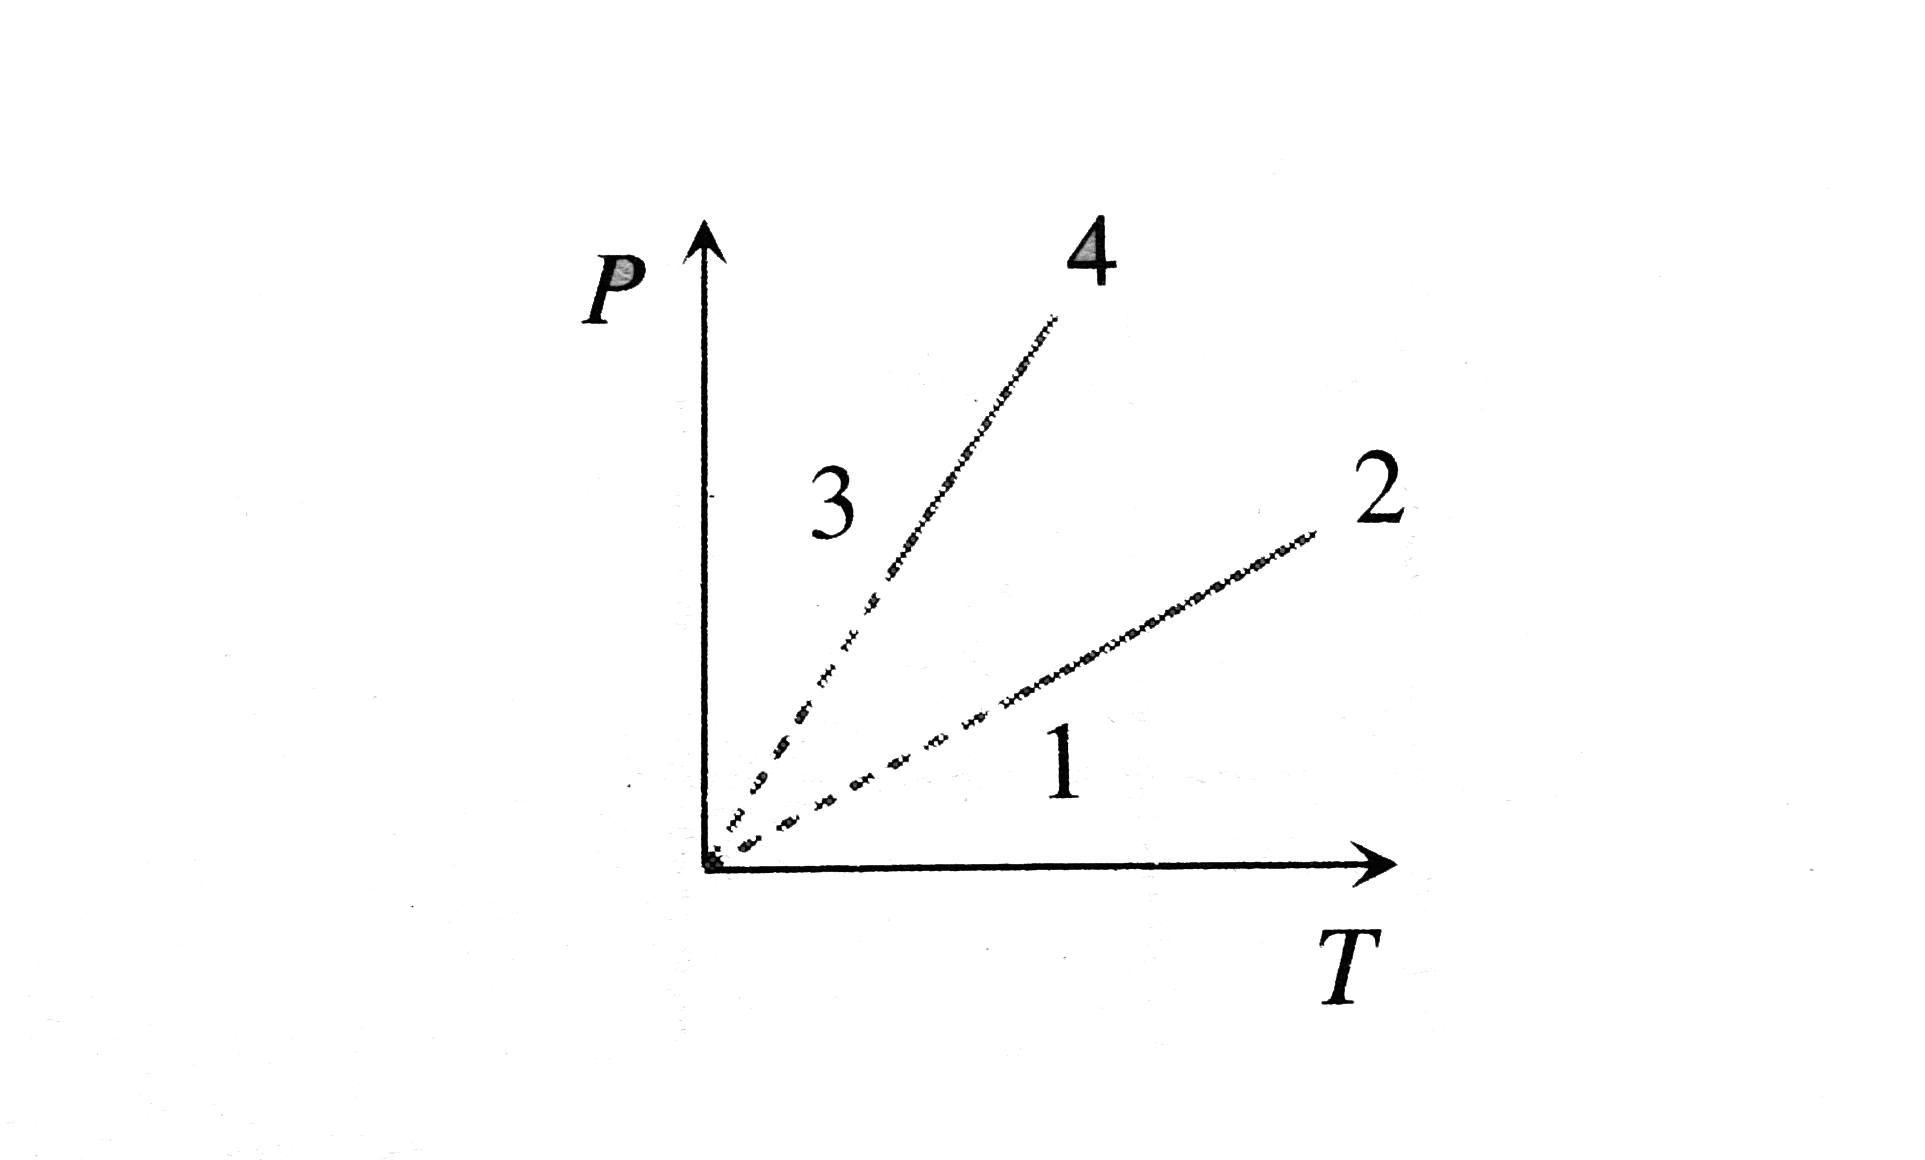
- Pressure versus temperature graph of an ideal gas of equal number of m...
Text Solution
|
- A cylindrical steel plug is inserted into a circular hole of diameter ...
Text Solution
|
- The given curve represents the variation of temperature as a function ...
Text Solution
|
- The mass of hydrogen molecule is 3.32xx10^(-27) kg. If 10^(23) hydroge...
Text Solution
|
- The coefficient of apparent expansion of a liquid in a copper vessel i...
Text Solution
|
- Two identical containers joned by a small pipe initially contain the s...
Text Solution
|
- A piece of metal weighs 46 g in air and 30 g in liquid of density 1.24...
Text Solution
|
- A vertical cylinder closed at both ends is fitted with a smooth piston...
Text Solution
|
- Three rods of equal length are joined to from an equilateral triangle ...
Text Solution
|
- A cylindrical tube of uniform cross-sectional area A is fitted with tw...
Text Solution
|