To solve the problem of determining the curve between magnetic moment and temperature of a magnet, we can follow these steps:
### Step 1: Understand the Relationship Between Magnetic Moment and Temperature
The magnetic moment of a material is influenced by its temperature. As temperature changes, the magnetic properties of the material can transition between different states such as ferromagnetism, paramagnetism, and diamagnetism.
### Step 2: Identify the Different Regions of Magnetic Behavior
1. **Ferromagnetism (Region AB)**: At low temperatures, materials exhibit ferromagnetism, where the magnetic moments are aligned.
2. **Paramagnetism (Region BC)**: As the temperature increases, the thermal agitation causes the alignment of magnetic moments to decrease, leading to paramagnetism.
3. **Diamagnetism (Region CD)**: At even higher temperatures, materials may exhibit diamagnetism, where the magnetic susceptibility becomes negative and does not change significantly with temperature.
### Step 3: Analyze the Susceptibility vs. Temperature Curve
The curve of magnetic susceptibility (χ) versus temperature (T) typically shows:
- A sharp increase in susceptibility as the temperature approaches the Curie temperature (T_C) for ferromagnetic materials.
- A peak at T_C, after which susceptibility decreases, transitioning into paramagnetism.
- A plateau or slight decrease in susceptibility as temperature continues to rise, indicating diamagnetism.
### Step 4: Relate Susceptibility to Magnetic Moment
Magnetic susceptibility (χ) is proportional to the magnetic moment (μ) of the material. Therefore, the curve of magnetic moment versus temperature will follow a similar trend to that of susceptibility:
- It will increase in the ferromagnetic region, peak at the Curie temperature, and then decrease in the paramagnetic region, eventually leveling off in the diamagnetic region.
### Step 5: Choose the Correct Option
Based on the analysis of the curve:
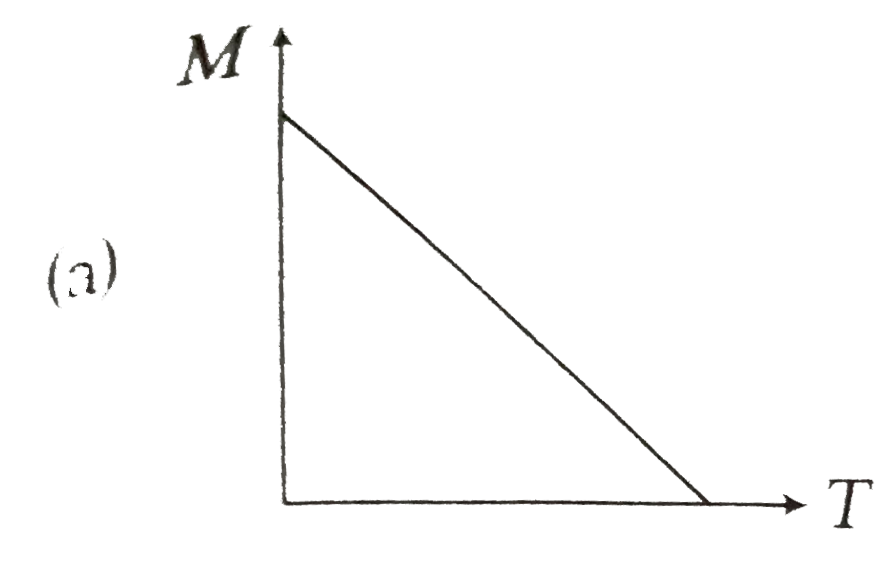
- **Option A** does not show the correct trend.
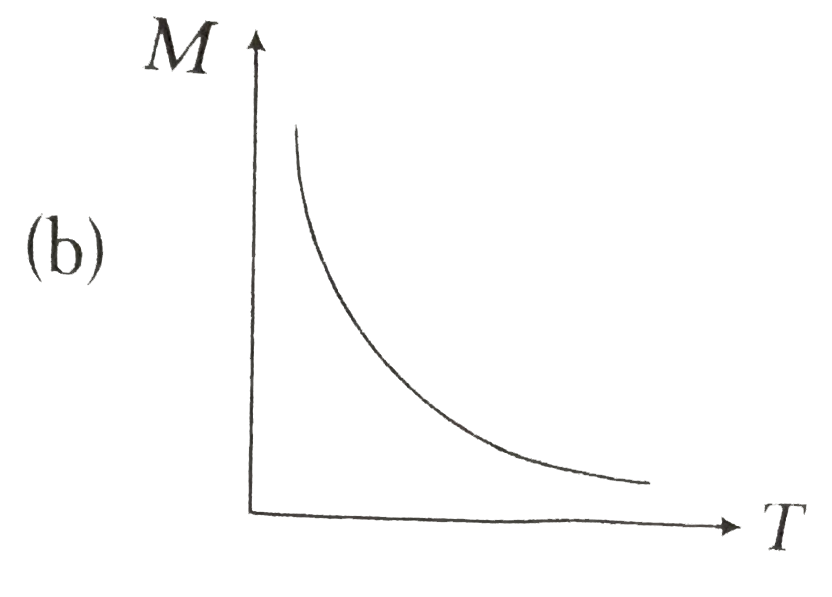
- **Option B** also fails to represent the expected behavior.
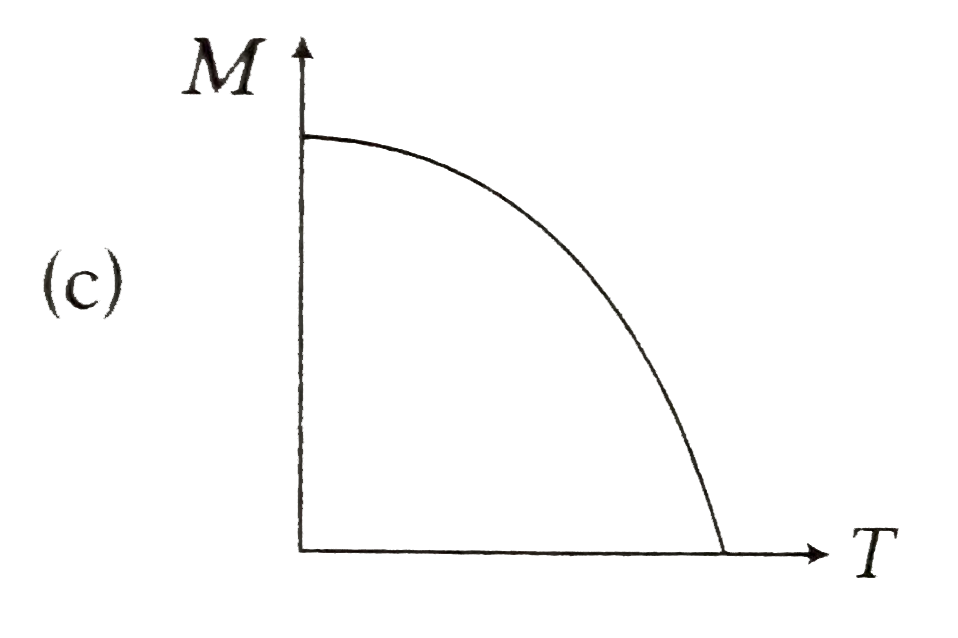
- **Option C** shows an initial increase followed by a decrease, which aligns with our understanding of the magnetic moment's behavior with temperature.
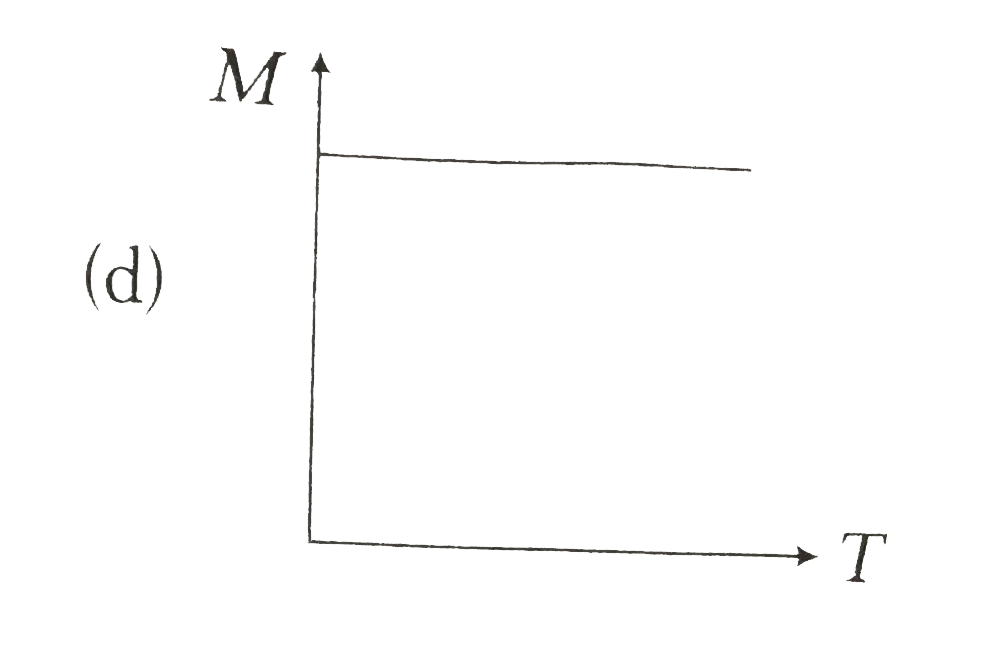
- **Option D** does not correctly represent the trend.
Thus, **Option C** is the correct choice.
### Summary of the Solution
The curve between magnetic moment and temperature shows an initial increase in the ferromagnetic region, a peak at the Curie temperature, followed by a decrease in the paramagnetic region, and a plateau in the diamagnetic region. The correct option representing this behavior is Option C.
---