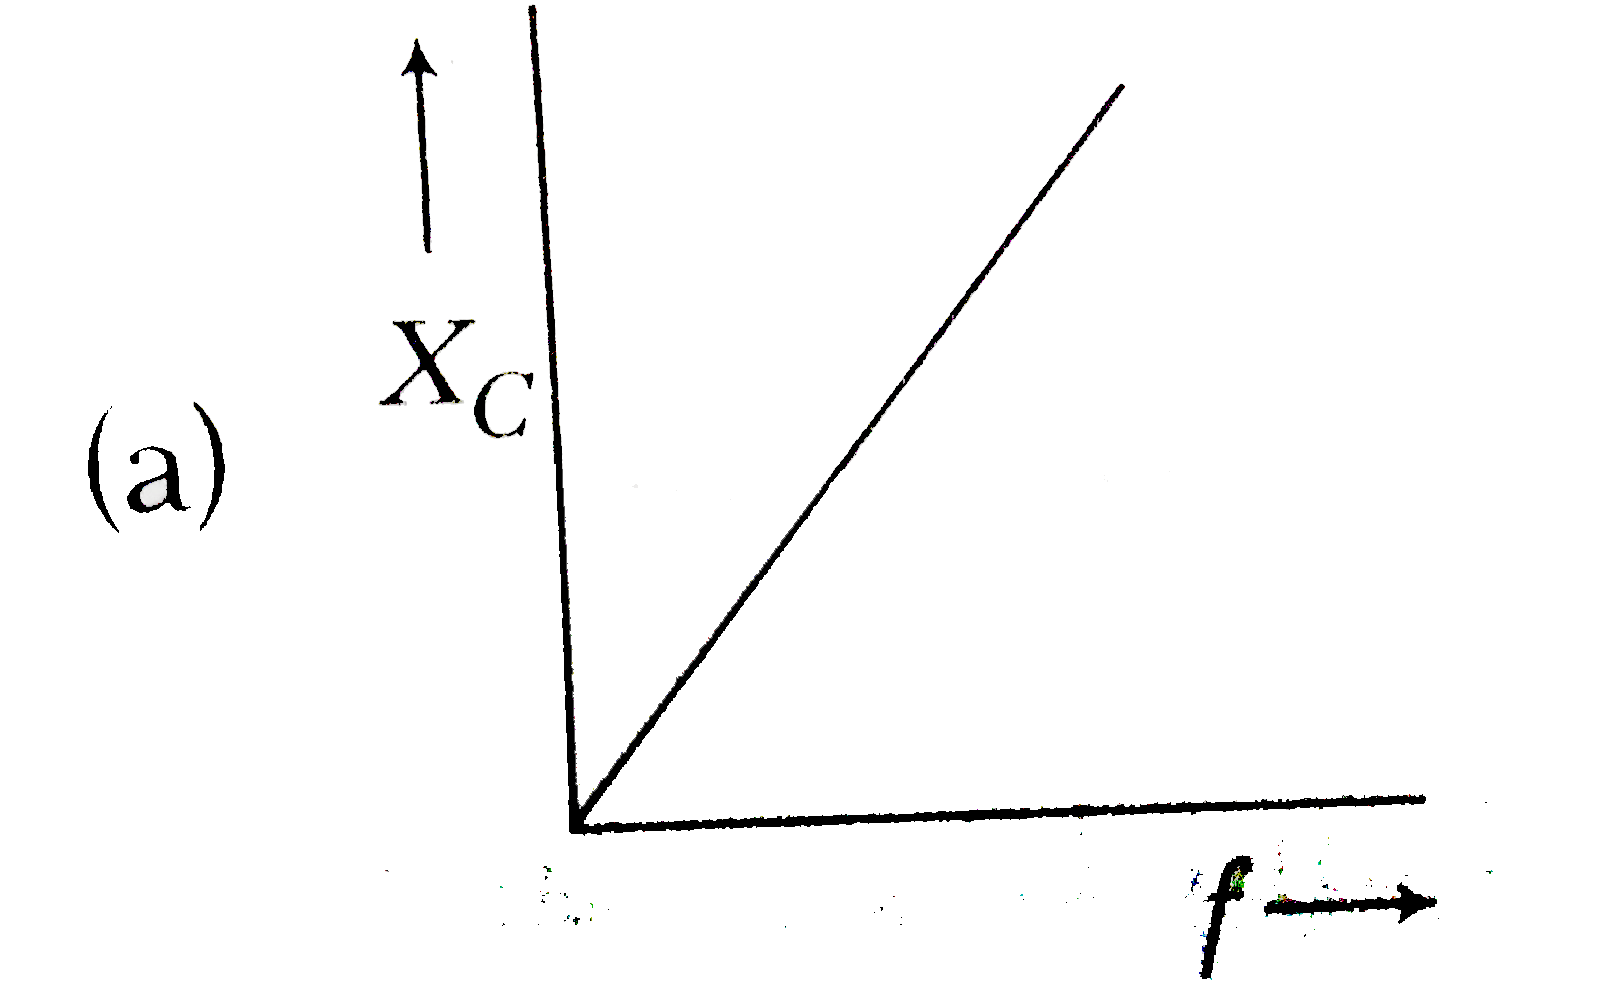
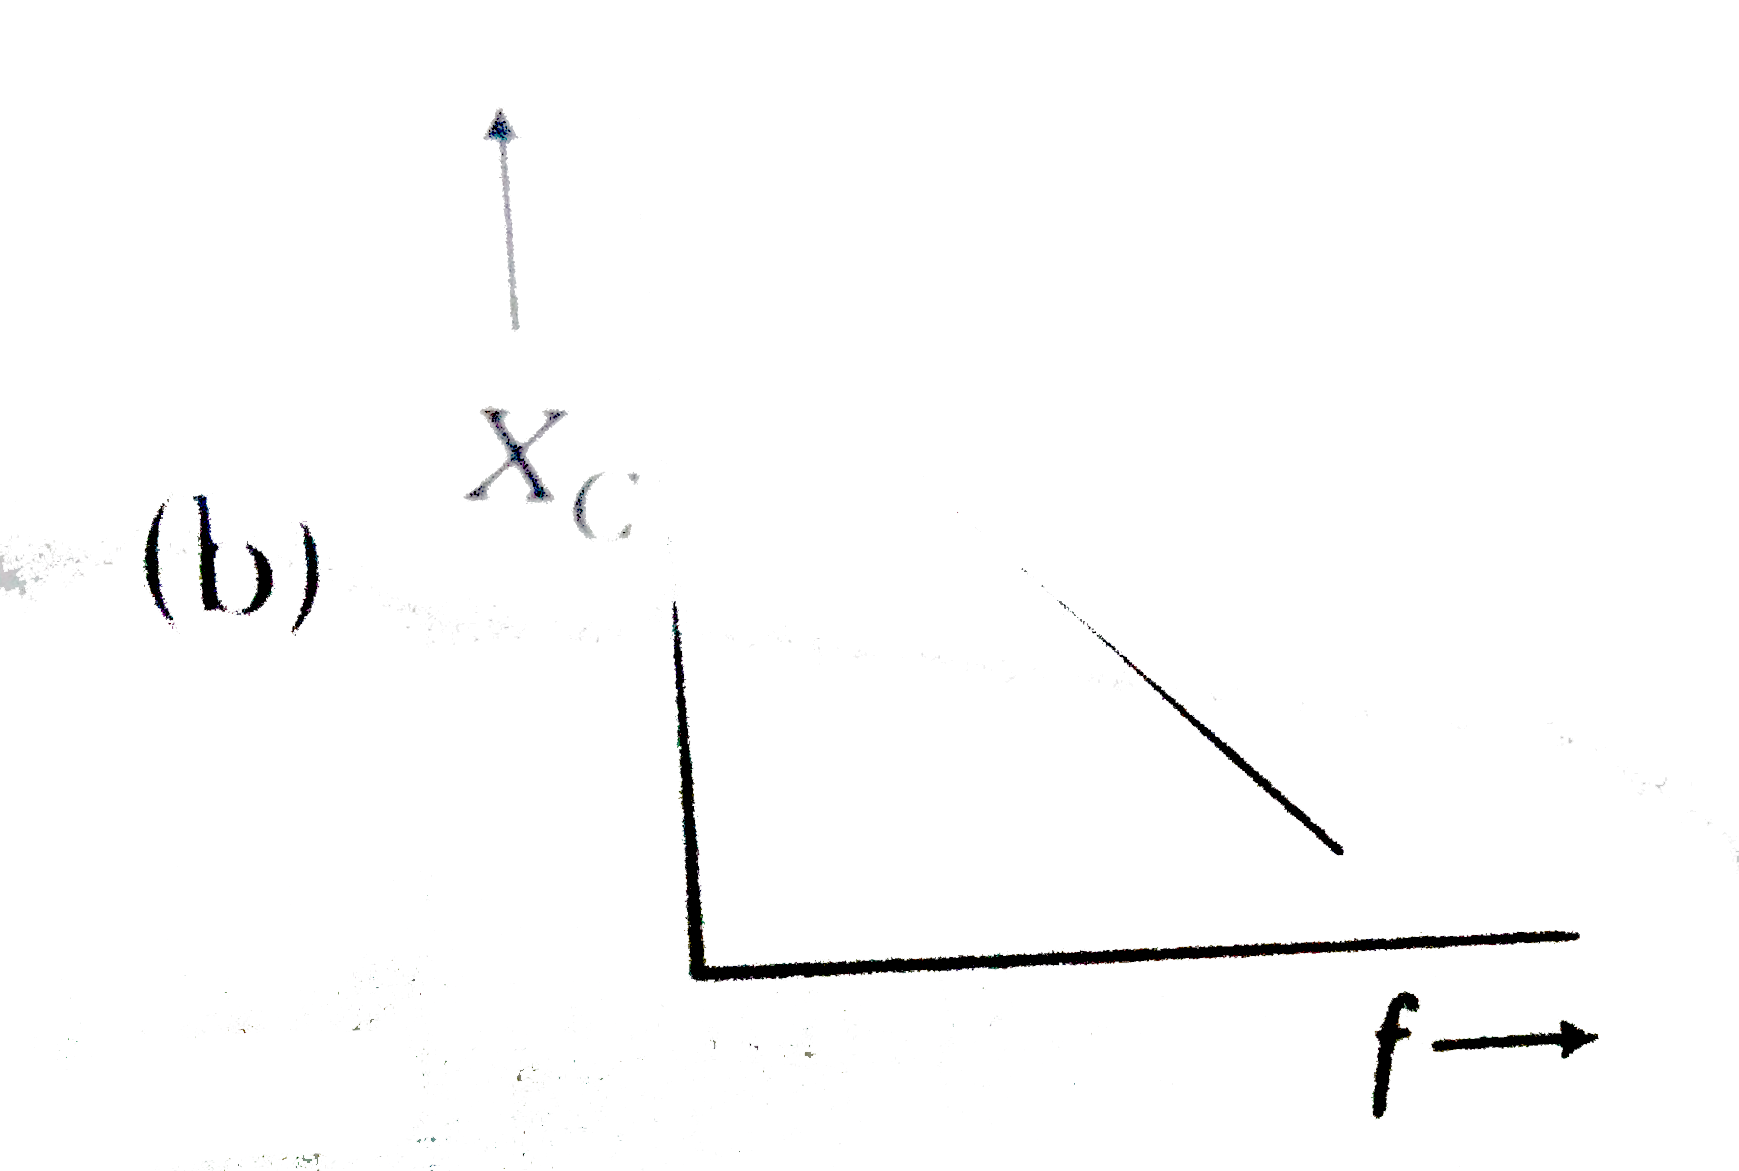
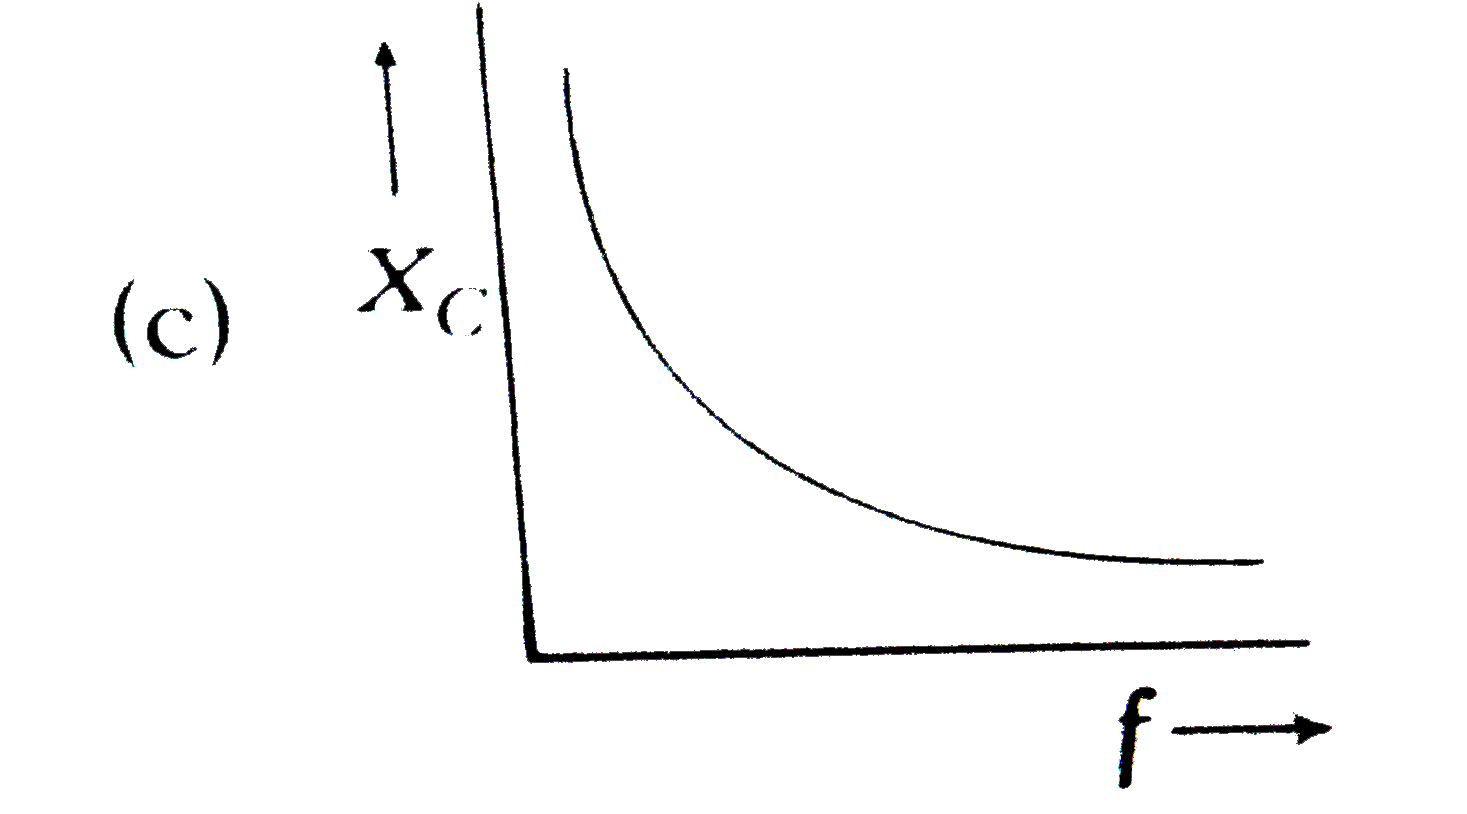
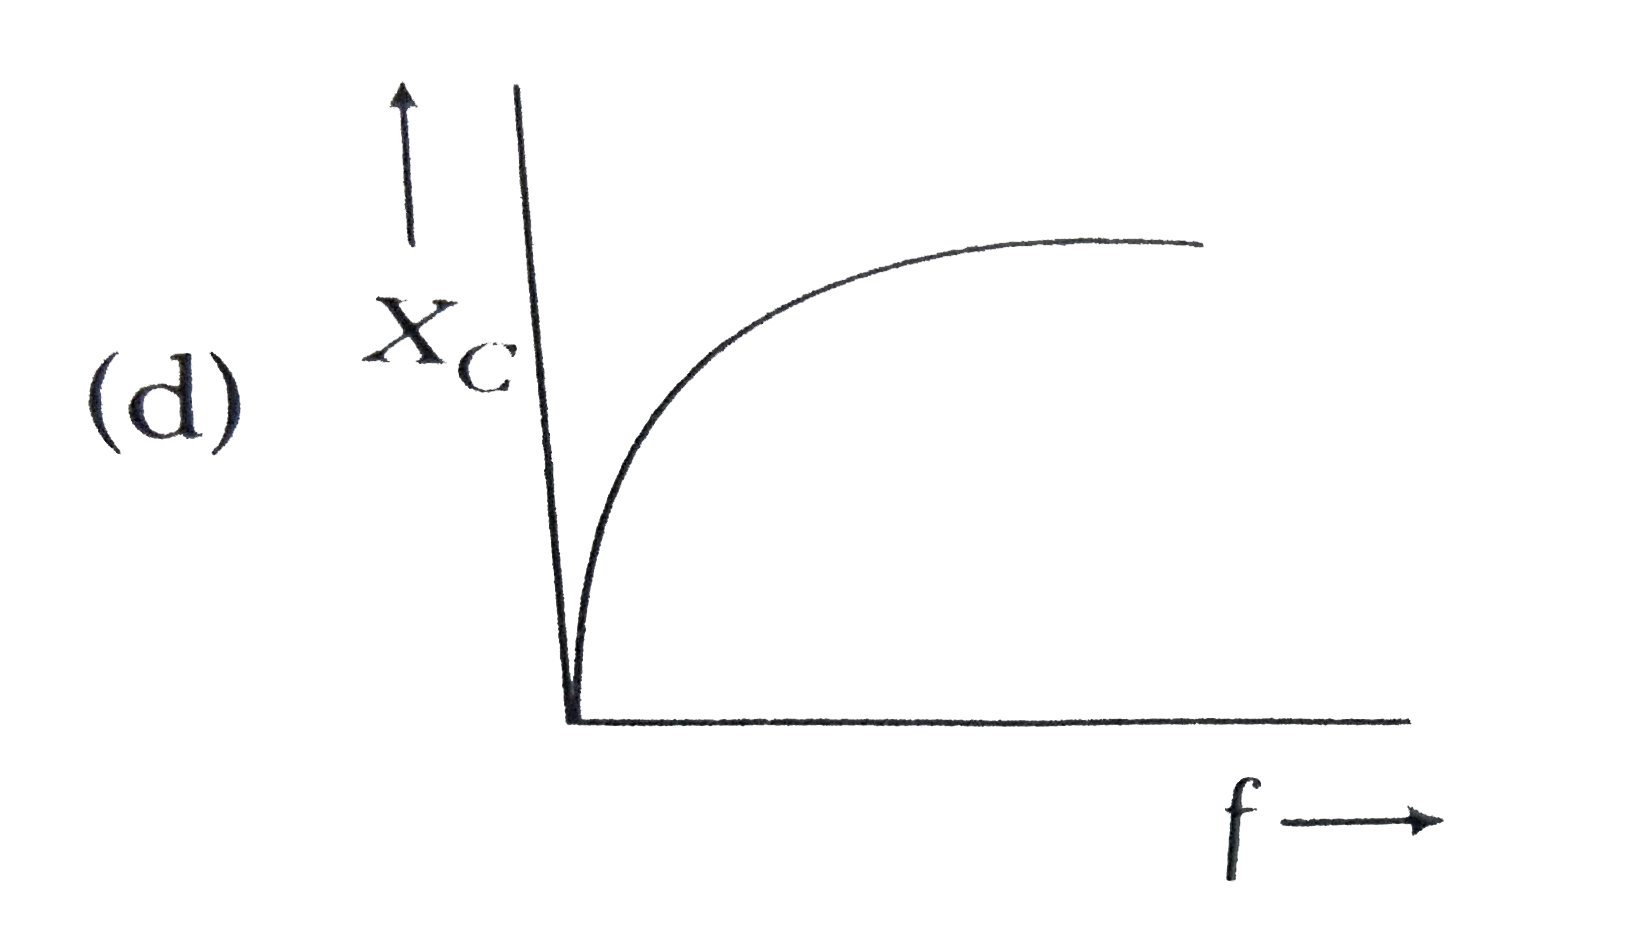
Home
Class 12
PHYSICS
Which of the following curves correctly ...

Which of the following curves correctly represent the variation of capacitve reactance (`underset(C )(X)`) with frequency (f) ?

A

B

C

D

Text Solution

AI Generated Solution

The correct Answer is:
To determine the correct curve representing the variation of capacitive reactance (Xc) with frequency (f), we can follow these steps: ### Step-by-Step Solution: 1. **Understand the Formula for Capacitive Reactance**: The capacitive reactance (Xc) is given by the formula: \[ X_c = \frac{1}{\omega C} \] where \(\omega\) is the angular frequency. 2. **Relate Angular Frequency to Frequency**: The angular frequency \(\omega\) can be expressed in terms of frequency (f) as: \[ \omega = 2\pi f \] Substituting this into the formula for Xc gives: \[ X_c = \frac{1}{2\pi f C} \] 3. **Analyze the Relationship**: From the equation \(X_c = \frac{1}{2\pi f C}\), we can see that Xc is inversely proportional to frequency (f). This means that as frequency increases, the capacitive reactance decreases. 4. **Graphical Representation**: The relationship \(X_c \propto \frac{1}{f}\) indicates that the graph of Xc versus f will be a rectangular hyperbola. This is because the product of Xc and f remains constant for a given capacitance C. 5. **Identify the Correct Curve**: Among the given options, we need to find the one that represents a hyperbolic curve that decreases as frequency increases. Based on the analysis, option C is the correct representation. ### Final Answer: The correct curve that represents the variation of capacitive reactance (Xc) with frequency (f) is **option C**.
Promotional Banner

Similar Questions

Explore conceptually related problems

Which of the following graphs correctly represents the variation of g on the - Earth?

Which of the following correctly represents the order of atomic radii

Which one of the following structures is correctly represented.

Which of the following curves represents the Henry's law ?

Which of the following correctly represents the stability of reactive intermediate?

Which of the following correctly represent the acidic strenth of given acids?

Identify the graph which correctly reperesents the variation of capacitive reactance X_C with frequency

Identify the graph which correctly reperesents the variation of capacitive reactance X_C with frequency

Which of the following curves represent(s) Boyle's law?