A
B
C
D
Text Solution
Verified by Experts
The correct Answer is:


Similar Questions
Explore conceptually related problems
Recommended Questions
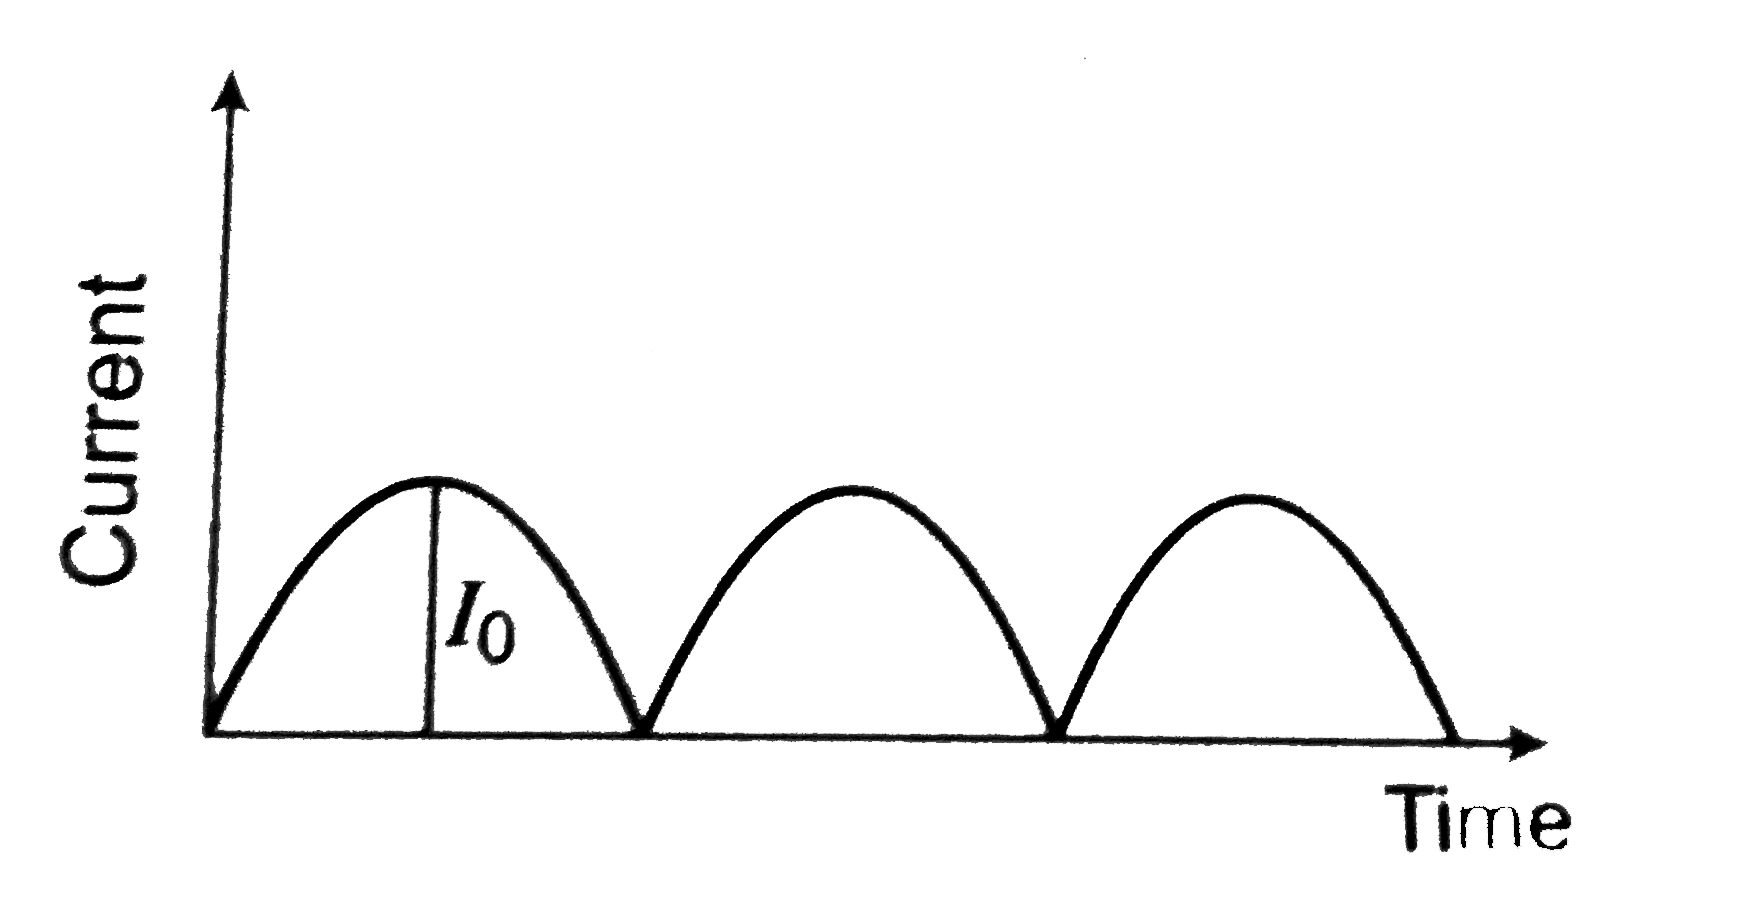
- The output current versus time curve of a rectifier is shown in the fi...
Text Solution
|
- The output current versus time curve of a rectifire is shown in the fi...
Text Solution
|
- In a full wave rectifiers, input ac current has a frequency 'v'. The o...
Text Solution
|
- The average value of output direct current in a full wave rectifier is
Text Solution
|
- A full wave rectifier circuit along with the input and output voltages...
Text Solution
|
- 60 Hz आवृति का एक प्रत्यावर्ती धारा निवेशी सिग्नल का दिष्टकरण किया जात...
Text Solution
|
- अर्द्ध तरंग दिष्टकारी में औसत निर्गत धारा का मान है
Text Solution
|
- An laternativing voltage of 350 V, 60 Hz is applied on a full wave rec...
Text Solution
|
- (A) : Current versus time graph is as shown in figure, rms value of cu...
Text Solution
|