Home
Class 12
PHYSICS
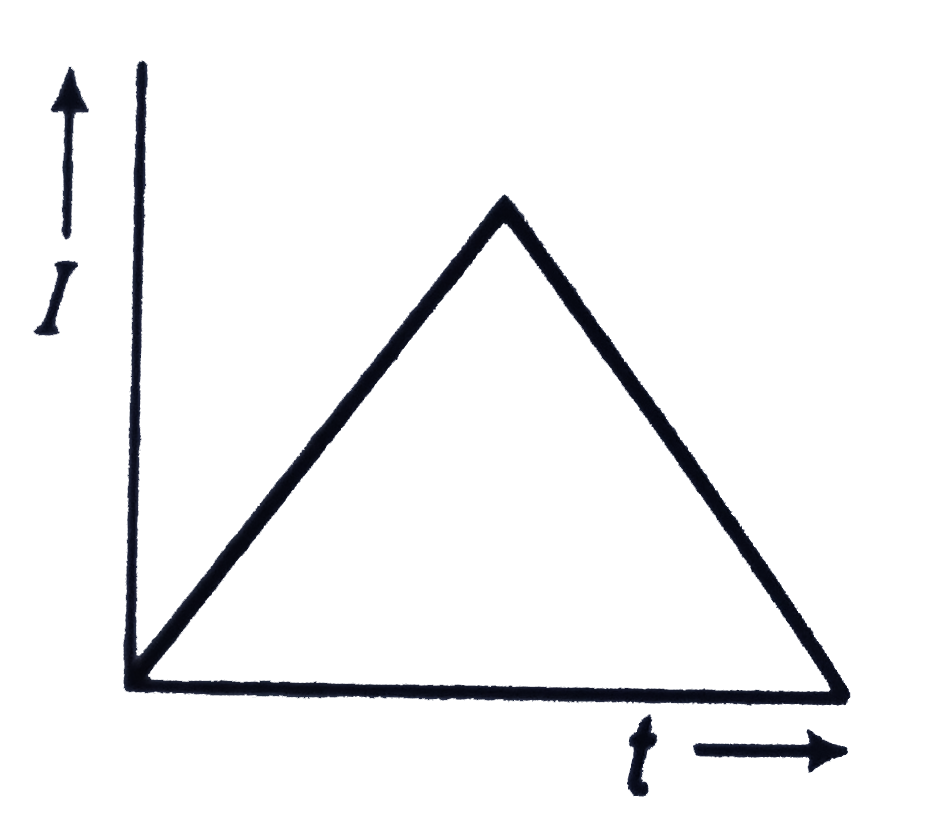
An alternating current I in an inductanc...

An alternating current `I` in an inductance coil varies with time `t` according to the graph as shown: Which one of the following graph gives the variation of voltage with time?

A

B

C

D

Text Solution

Verified by Experts

The correct Answer is:
B
Promotional Banner

Similar Questions

Explore conceptually related problems

The current I in an inductance coil varies with time according to the graph given in the figure. Which one of the following graphs gives the variation of voltage with time across the inductor?

The current i in an induction coil varies with time according to the graph shown in figure. Which of the following graph shows induced emf in the coil with time:

The current (I) in the inductance is varying with time according to the plot shown in figure. Which one of the following is the correct variation of voltage with time in the coil?

The current (I) in the inductance is varying with time according to the plot shown in figure. Which one of the following is the correct variation of voltage with time in the coil?

The current i in an induction coil varies with time t according to the graph shown in the figure-5.250. Which of the following graphs shows the induced EMF in the coil with time ?

The current i in an inductionn coil varies with time t according to the graph shown in the figure. Which of the following grahs shows athe induced emf (epsilon) in the coil with time?

The current i in an inductionn coil varies with time t according to the graph shown in the figure. Which of the following grahs shows athe induced emf (epsilon) in the coil with time?

The graph between the current and the time for an inductance coil is shown below. Which of the following graph show the voltage-time variation-

The graph shown the variation with times t of the velocity v of an object . Which one of the following graphs best represents the variation of acceleration a of the object with time t ?

Switch S of the circuit shows in Fig. is closed at t = 0 . If e denotes the induced emf in L and i the current flowing through the circuit at time t , then which of the following graphs correctly represents the variation of e with i ?