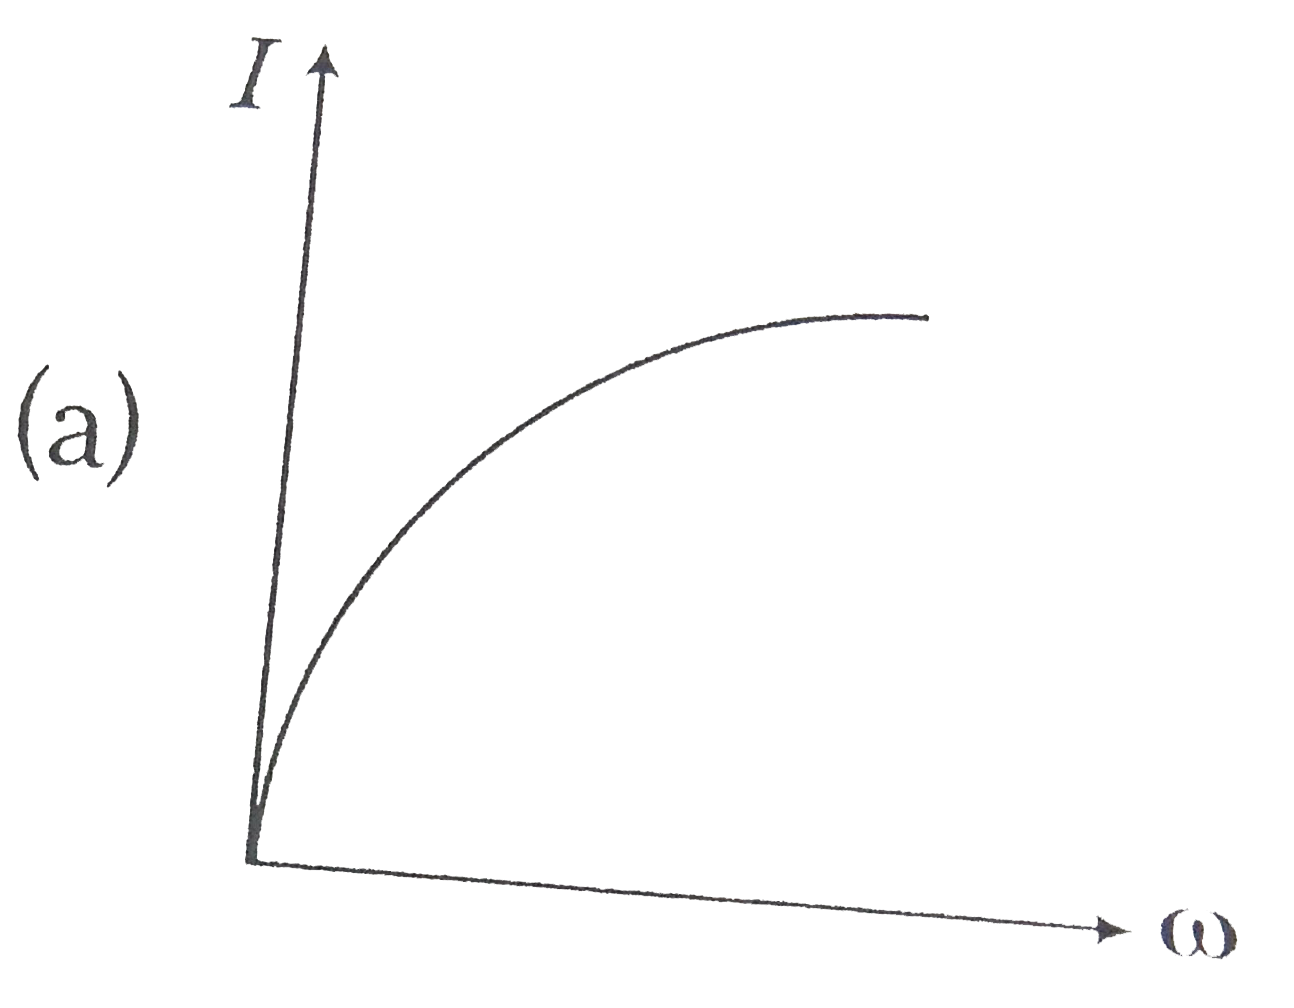
A
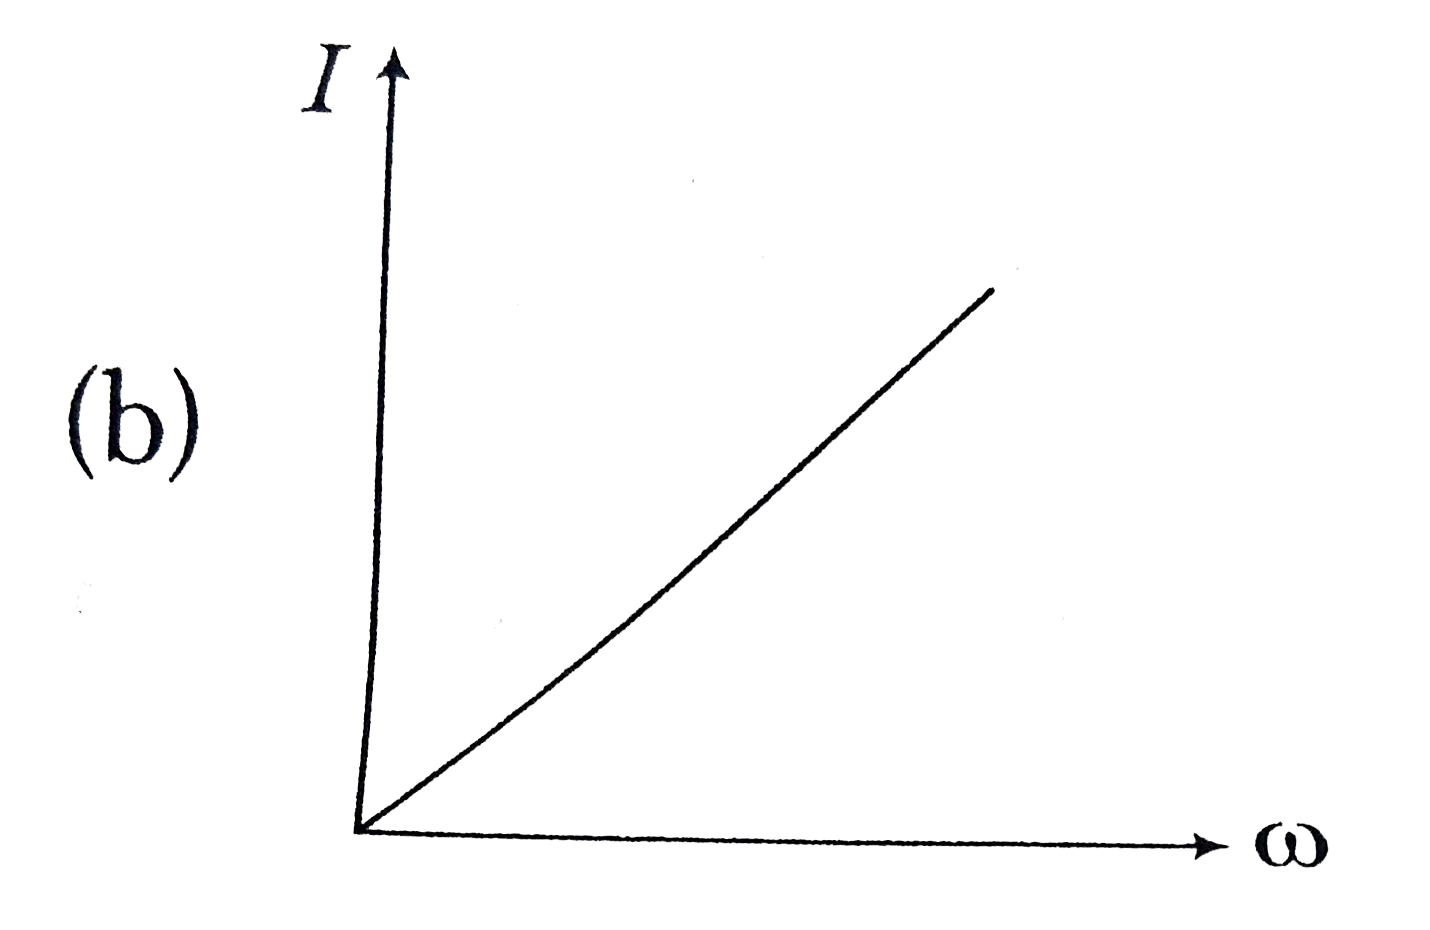
B
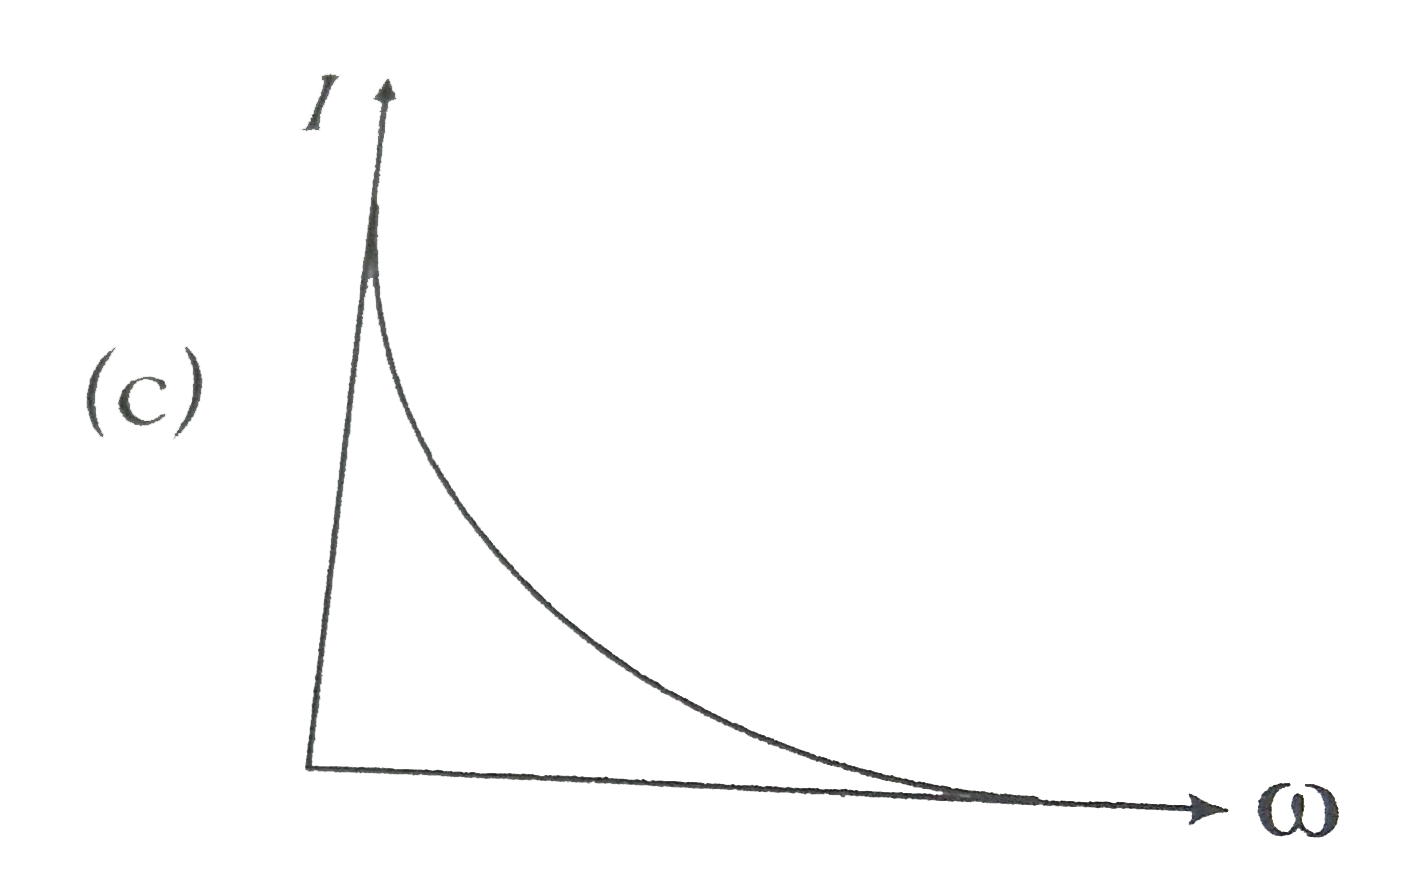
C
D
Text Solution
Verified by Experts
The correct Answer is:


Similar Questions
Explore conceptually related problems
Recommended Questions
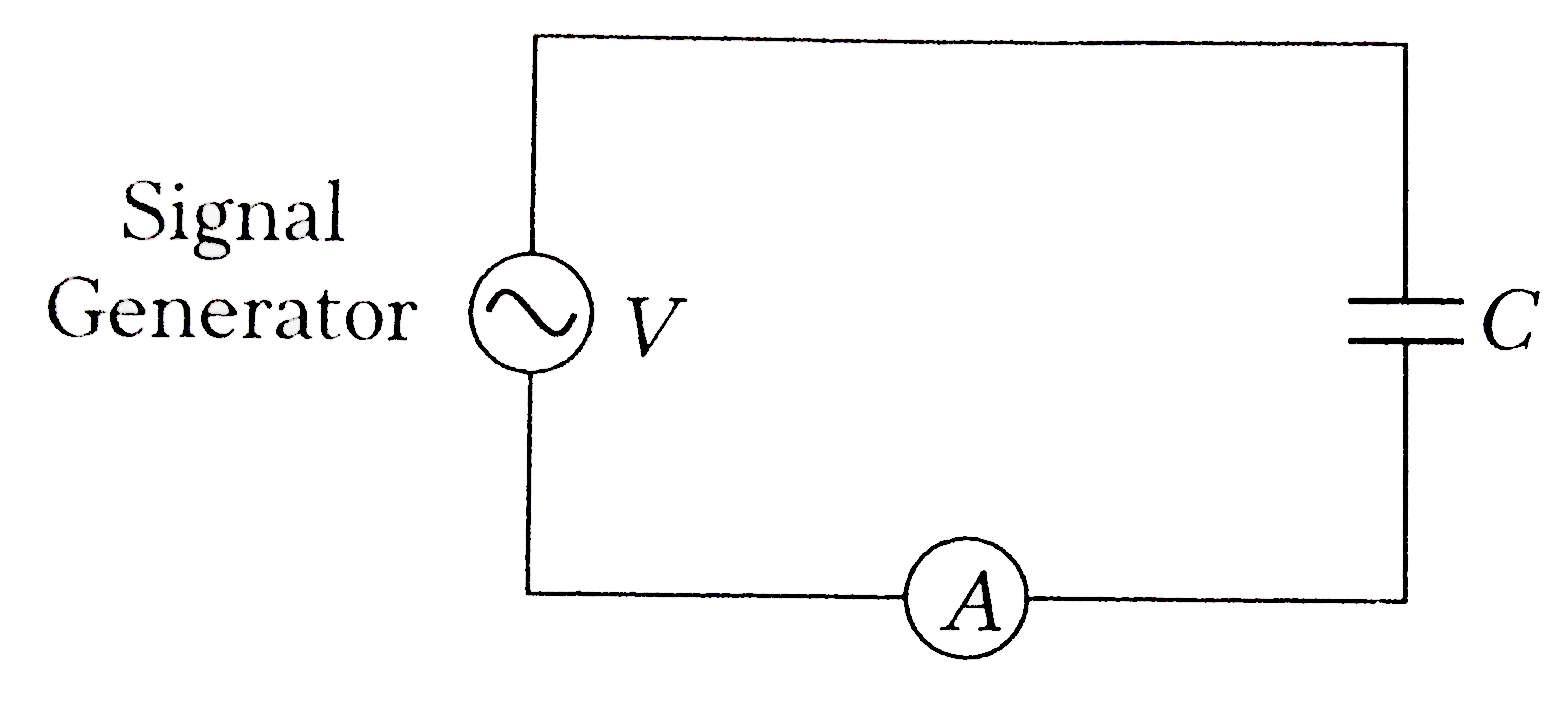
- A constant voltage at different frequencies is applied across a capaci...
Text Solution
|
- Identify the graph which correctly reperesents the variation of capaci...
Text Solution
|
- A constant voltage at different frequencies is applied across a capaci...
Text Solution
|
- Different voltages are applied across a P-N junction and the currents ...
Text Solution
|
- A constant voltage at different frequencies is applied across a capaci...
Text Solution
|
- An AV voltage source is applied across an R-C circuit. Angular frequen...
Text Solution
|
- A constant voltage at different frequencies is applied across a capaci...
Text Solution
|
- In the circuit shown in figure , the supply has a constant rms value V...
Text Solution
|
- The current in a circuit containing a capacitance C and a resistance R...
Text Solution
|