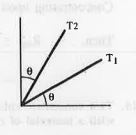
 . Here `(T_2 - T_1)` is proportional to
A
B
C
D
Text Solution
Verified by Experts


Similar Questions
Explore conceptually related problems
Recommended Questions
- The VI graphs for a conductor at temperature T1 and T2 are shown in th...
Text Solution
|
- t1 = (sintheta)^costheta ,t2 = (sintheta)^sintheta , t3 = (costheta)^c...
Text Solution
|
- The current - voltage graphs for a given metallic wire at two differen...
Text Solution
|
- The current voltage graphs for a given metalic wire two different temp...
Text Solution
|
- The V-i graph for a conductor at temeratures T1 and T2 are as shown in...
Text Solution
|
- The V - I graphs for a conductor at temperature T1 and T2 are shown in...
Text Solution
|
- ताप T1 तथा T2 (T2 gt T1) पर कृष्णिका विकिरण वक्र नीचे दिखाए गए है। इनम...
Text Solution
|
- V-I graph for a mettalic wire at two different temperatures T1 and T2 ...
Text Solution
|
- p - V diagram of same mass of a gas are drawn at two different tempera...
Text Solution
|