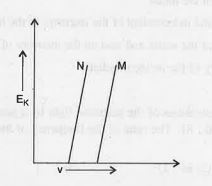
 of photoelectron versus frequency of incident radiation is shown for two metals M and N. We may definitely conclude
A
B
C
D
Text Solution
Verified by Experts


Similar Questions
Explore conceptually related problems
Recommended Questions
- The graph of Kinetic energy of photoelectron versus frequency of inc...
Text Solution
|
- The maximum kinetic energy of the emitted photoelectrons against frequ...
Text Solution
|
- According to Einstein's photoelectric equation, the graph between the ...
Text Solution
|
- According to Einstein's photoelectric equation, the graph between kine...
Text Solution
|
- For three different metals A,B,C photoemission is observed one by one....
Text Solution
|
- The kinetic energy (E(k)) of a photoelectron varies with the frequency...
Text Solution
|
- Kinetic energy of surface photoelectrons is x when frequency of incide...
Text Solution
|
- According to Einstein's photoelectric equation, the graph of KE of the...
Text Solution
|
- According to Einstein's photoelectric equation the graph of K.E. of th...
Text Solution
|