Home
Class 11
MATHS
The mean and S.D. of marks obtained by 5...

The mean and S.D. of marks obtained by 50 students of a class in three subjects mathematics , physics and chemistry are given below?

which of the three subjects the highest variability in marks and which shows the lowest?

Promotional Banner

Topper's Solved these Questions

  • SETS

    A N EXCEL PUBLICATION|Exercise QUESTION BANK|268 Videos
  • STRAIGHT LINES

    A N EXCEL PUBLICATION|Exercise QUESTION BANK|167 Videos

Similar Questions

Explore conceptually related problems

The mean and standard deviation of marks obtained by 50 students of a class in three subjects , mathematics ,Physics and Chemistry are given below : Which of the three subject shows the highest variability in marks and which shows the lowest?

The mean and standard deviation of marks obtained by. 50 students of a class in. three subjects, Mathematics, Physics and Chemistry are given below. Which of three subjects shows the highest variability, in marks and which shows the lowest?

The mean and standard deviation of marks obtained by 50 students in a class in two subjects , mathematics and accountancy are given below : Which of the subject shows the highest variability in marks? and why?

Marks obtained in mathematics examination are given below:(i)Mean of the marks……..

Consider the following data in respect of marks of 50 students in mathematics and physics. Which subject shows more consistent?

Consider the following data in respect of marks of 50 students in mathematics and physics. Which subject shows more variability?

Mean mark scored by the students of a class is 53. The mean mark of the girls is 55 and the mean mark of the boys is 50. What is the percentage of girls in the class ? a) 60% b) 40% c) 50% d) 45%

The mean and S.D. of a group of 100 observations were found to be 20 and 3 respectively. Later on its was found that three observations were incorrect which were recorded as 21,21 and 18 find the mean S.D. if the incorrect observations were omitted.

A N EXCEL PUBLICATION-STATISTICS-QUESTION BANK
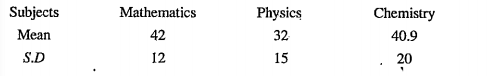
  1. Consider the following data calculate the mean of the above data

    Text Solution

    |

  2. The scores of batsman A are 40 ,70,52,34,42,55,63,46,54,44 find their ...

    Text Solution

    |

  3. The scores of batsman A are 40 ,70,52,34,42,55,63,46,54,44 find their ...

    Text Solution

    |

  4. The scores of batsman A are 40 ,70,52,34,42,55,63,46,54,44 Find their ...

    Text Solution

    |

  5. The scores of batsman A are 40 ,70,52,34,42,55,63,46,54,44 find the st...

    Text Solution

    |

  6. Given the following data find the mean of the given data.

    Text Solution

    |

  7. Given the following data find the standard deviation of the given...

    Text Solution

    |

  8. Consider the following grouped frequency distribution find the mea...

    Text Solution

    |

  9. Consider the following grouped frequency distribution find the vari...

    Text Solution

    |

  10. Consider the following grouped frequency distribution find the stan...

    Text Solution

    |

  11. Consider the following grouped frequency distribution find the C.V...

    Text Solution

    |

  12. If k is a negative constant , what is the relation between sigmau and ...

    Text Solution

    |

  13. The mean and variance of 8 observations are 9 and 9.25 respectively. S...

    Text Solution

    |

  14. The mean and variance of 7 observations are 8 and 16 respectively . If...

    Text Solution

    |

  15. Suppose that mean and standard deviation of 6 observations are 8 and 4...

    Text Solution

    |

  16. Given that barx Is the mean and sigma^2 is the variance of n observati...

    Text Solution

    |

  17. The mean and S.D. of 20 observations are found to be 10 and 2 respecti...

    Text Solution

    |

  18. The mean and S.D. of 20 observations are found to be 10 and 2 respecti...

    Text Solution

    |

  19. The mean and S.D. of marks obtained by 50 students of a class in three...

    Text Solution

    |

  20. The mean and S.D. of a group of 100 observations were found to be 20 a...

    Text Solution

    |