 .
. 


Similar Questions
Explore conceptually related problems
Recommended Questions
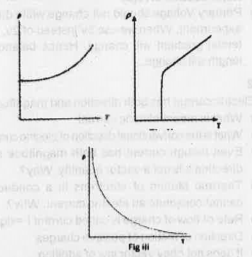
- The variation of resistivity (e) with temperature (T) of a conductor, ...
Text Solution
|
- How do the electrical conductivity and resistivity of metallic conduct...
Text Solution
|
- The variation of resistance of a metallic conductor with temperature i...
Text Solution
|
- Show on graph, the variation of resistivity with temperature for a typ...
Text Solution
|
- Show variation of resistivity of (i) conductor (i.e. copper) (ii) sem...
Text Solution
|
- Explain the variation of resistivity of conductor and semiconductor wi...
Text Solution
|
- Variation of resistance of the conductor with temperature is shown . T...
Text Solution
|
- How does electrical resistivity of the following classes of materials ...
Text Solution
|
- The value of resistivity of super conductor is
Text Solution
|