


Similar Questions
Explore conceptually related problems
Recommended Questions
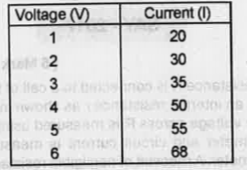
- Table given below shows the current (I) voltage (V) relationship of a ...
Text Solution
|
- Draw V - I graph for ohmic and non-ohmic materials. Give one example f...
Text Solution
|
- Draw V-I garaph of Ohmic and non-ohmic conductors.
Text Solution
|
- What are ohmic and non ohmic devices ?
Text Solution
|
- Distinguish between ohmic & non-ohmic device.
Text Solution
|
- Draw V-I graph for omhic & non-ohmic materials. Give example.
Text Solution
|
- Of the following graphs, the one that correctly represents the I-V cha...
Text Solution
|
- Draw V-I graph for ohmic and non-ohmic materials. Give one example for...
Text Solution
|
- Draw the V-I graph for ohmic and non-ohmic conductors.
Text Solution
|