Text Solution
Verified by Experts


Similar Questions
Explore conceptually related problems
Recommended Questions
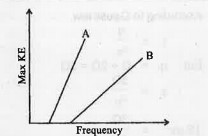
- The given graph shows the variation of KE with frequency of incident r...
Text Solution
|
- The stopping potential as a function of the frequency of the incident ...
Text Solution
|
- The graph shows variation of stopping potential V(0) versus frequency ...
Text Solution
|
- The following figure shows a graph for the stopping potential as a fun...
Text Solution
|
- The stopping potential as a function of frequency of incident radiatio...
Text Solution
|
- Draw graphs showing variation of photoelectric current with applied vo...
Text Solution
|
- The graph shows the variation of stopping potential with frequency of ...
Text Solution
|
- Darw graphs showing variation of photoelctric current with applied ...
Text Solution
|
- The given graph shows the variation of KE with frequency of incident r...
Text Solution
|