Text Solution
Verified by Experts


Similar Questions
Explore conceptually related problems
Recommended Questions
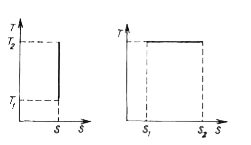
- Plot the T-S diagram (i.e. the entropy vs temperature dependence) (a) ...
Text Solution
|
- Assertion: Isothermal and adiabatic, two processes are shown on p-V di...
Text Solution
|
- Calculate the total entropy change for the following reversible proces...
Text Solution
|
- Identify isothermal and adiabatic process in the following diagram
Text Solution
|
- Draw the approximate plots of isochoric, isobaric, isothermal, and adi...
Text Solution
|
- Isothermal Process and Adiabatic Process.
Text Solution
|
- The given diagram shows four processes i.e., isochoric, isobaric, isot...
Text Solution
|
- Define the following terms: (a) Isothermal process (b) adiabatic proce...
Text Solution
|
- The entropy change in adiabatic process is
Text Solution
|