


Topper's Solved these Questions
Similar Questions
Explore conceptually related problems
ICSE-ABSORPTION BY ROOTS-ASSERTION & REASON
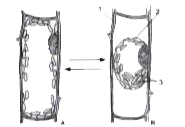
- In the given figures 'A' shows a cell in the normal state and 'B' show...
Text Solution
|
- Assertion (A): Most minerals must enter the root by active absorption ...
Text Solution
|
- Assertion: A special type of diffusion of water through a semi-permeab...
Text Solution
|
- Assertion: In hypertonic solution, a plant cell shrinks. Reason: Du...
Text Solution
|
- Assertion: In the turgid state, the cell is balanced i.e. no water ent...
Text Solution
|
- Assertion: Mineral nutrients are an essential constituent of the cell ...
Text Solution
|
- Assertion: Plants absorb water mostly by roots. Reason: Root cap re...
Text Solution
|
- Assertion: Imbibition involves the absorption of water molecules by li...
Text Solution
|