Text Solution
Verified by Experts
The correct Answer is:


Topper's Solved these Questions
Similar Questions
Explore conceptually related problems
ICSE-MODEL TEST PAPER-15 -SECTION-C
- D(3) for data: 16, 21, 27, 13, 19, 26, 25, 12, 17, 28 is
Text Solution
|
- D(9) is always equal to
Text Solution
|
- Q(2) for the data: 13, 16, 28, 17, 12, 25, 26, 19, 27, 21 is :
Text Solution
|
- The price index of a commodity in 2018 relative to 2015 is 125, If t...
Text Solution
|
- Find the index number by using simple aggregate method.
Text Solution
|
- Calculate the median and sixty first percentile from the following da...
Text Solution
|
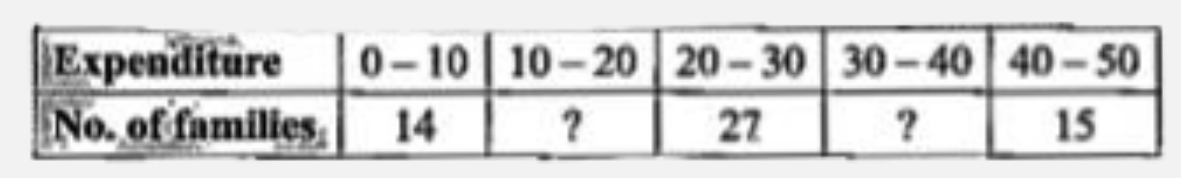
- The following table gives the distribution of 100 families according t...
Text Solution
|
- Calculate Spearman's rank correlation coefficient between the marks in...
Text Solution
|