A
B
C
D
Text Solution
Verified by Experts
The correct Answer is:


Topper's Solved these Questions
STATES OF MATTER
AAKASH SERIES|Exercise OBJECTIVE EXERCISE -2|140 VideosSTATES OF MATTER
AAKASH SERIES|Exercise OBJECTIVE EXERCISE -3|19 VideosSTATES OF MATTER
AAKASH SERIES|Exercise SUBJECTIVE EXERCISE -3 (VERY SHORT ANSWER QUESTIONS)|18 VideosSATURATED HYDROCARBONS
AAKASH SERIES|Exercise QUESTIONS FOR DESCRIPTIVE ANSWERS|10 VideosSTOICHIOMETRY
AAKASH SERIES|Exercise QUESTIONS FOR DESCRIPTIVE ANSWERS|59 Videos
Similar Questions
Explore conceptually related problems
AAKASH SERIES-STATES OF MATTER-OBJECTIVE EXERCISE -1
- For an ideal gas, number of moles per lit in terms of pressure (P), ga...
Text Solution
|
- From the graph the correct order of temperature is
Text Solution
|
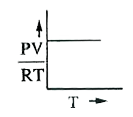
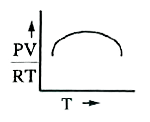
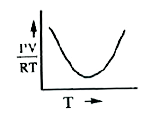
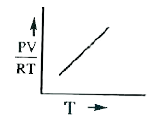
- For an ideal gas the graph between PV/RT and T is
Text Solution
|
- One mole of argon will have least density at
Text Solution
|
- What are the conditions under which the relation between 'V' and 'n' a...
Text Solution
|
- Which of the following shows ideal gas behaviour
Text Solution
|
- When universal gas constant (R) is divided by Avogadro number(N), then...
Text Solution
|
- From the graph the order of pressure of a gas is
Text Solution
|
- Value of gas constant (R) is
Text Solution
|
- Kinetic energy of molecules is least in
Text Solution
|
- The molar volume of CO2 is maximum at
Text Solution
|
- 15 g of ethane at 380 torr and 273^@ C occupy a volume of
Text Solution
|
- The value of the universal gas constant R depends upon the
Text Solution
|
- At constant volume, for a fixed number of moles of a gas, the pressure...
Text Solution
|
- Density of neon will be highest at
Text Solution
|
- Mixing of two gases by diffusion is
Text Solution
|
- The rate of diffusion of Hydrogen is about
Text Solution
|
- According to Graham's law at a given temp, the ratio of diffusion rA//...
Text Solution
|
- Which of the pairs of gases diffuse at a slower rate than CO(2)?
Text Solution
|
- Ammonia gas diffuses twice as fast as gas X. The gas 'X'is
Text Solution
|