A
B
C
D
Text Solution
Verified by Experts
The correct Answer is:


Topper's Solved these Questions
Similar Questions
Explore conceptually related problems
QUANTUM CAT-PERCENTAGES-QUESTION BANK
- The two pie charts show the market share of different companies which ...
Text Solution
|
- The two pie charts show the market share of different companies which ...
Text Solution
|
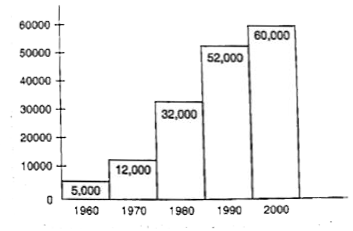
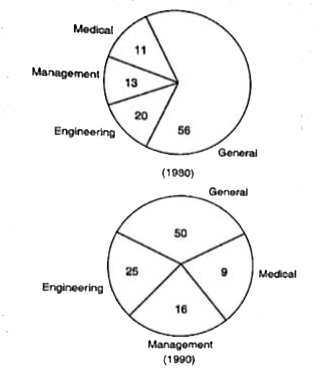
- Number of different colleges in India in different years is given in t...
Text Solution
|
- Number of different colleges in India in different years is given in t...
Text Solution
|
- Number of different colleges in India in different years is given in t...
Text Solution
|
- Number of different colleges in India in different years is given in t...
Text Solution
|
- Number of different colleges in India in different years is given in t...
Text Solution
|
- Answer the question based on the following information. The following ...
Text Solution
|
- Answer the question based on the following information. The following ...
Text Solution
|
- The value of x in the equation: 16x + 1/x = 8 is
Text Solution
|
- Answer the question based on the following information. The following ...
Text Solution
|
- Which of the following statements is true?
Text Solution
|
- A marketing company conducted a survey among 10,000 person in Kanpur :...
Text Solution
|
- A marketing company conducted a survey among 10,000 person in Kanpur :...
Text Solution
|
- If 20% of the persons who drive Bajaj's bike also drive another bike. ...
Text Solution
|
- A marketing company conducted a survey among 10,000 person in Kanpur :...
Text Solution
|
- A table below shows the production and imports of circle oil (in '000 ...
Text Solution
|
- A table below shows the production and imports of circle oil (in '000 ...
Text Solution
|
- A table below shows the production and imports of circle oil (in '000 ...
Text Solution
|
- A table below shows the production and imports of circle oil (in '000 ...
Text Solution
|