A
B
C
D
Text Solution
Verified by Experts
The correct Answer is:


Similar Questions
Explore conceptually related problems
Recommended Questions
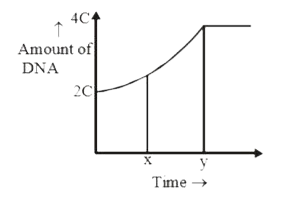
- The given graph shows the change in DNA content in a single cell durin...
Text Solution
|
- The given graph shows the change in DNA content during various phases ...
Text Solution
|
- Which of the following graphs shows the relative change in the amount ...
Text Solution
|
- The following graphs (A and B) depicts changes in DNA Content during c...
Text Solution
|
- Analyze the events occurring during every stage of the cell cycle, how...
Text Solution
|
- কোশচক্রের সময় যে দশায় DNA সংশ্লেষ ঘটে, সেটি হল
Text Solution
|
- By comparing mitosis and meiosis occurring in the same organism, which...
Text Solution
|
- The given graph shows the change in DNA content during various phases ...
Text Solution
|
- Which of the following graphs shows the relative change in the amount ...
Text Solution
|