A
B
C
D
Text Solution
Verified by Experts
The correct Answer is:


Similar Questions
Explore conceptually related problems
Recommended Questions
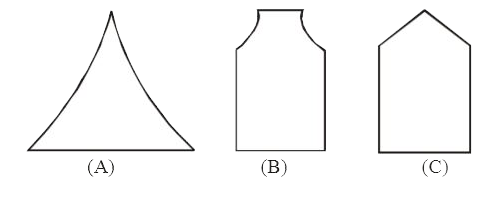
- Age structure diagrams (A, B and C) for the populations are shown belo...
Text Solution
|
- The age structures of a population represents
Text Solution
|
- Represent the connections shown below by a circuit diagram.
Text Solution
|
- How can age-sex structure of a population be depicted in a pyramid dia...
Text Solution
|
- The age structure of a population is its
Text Solution
|
- With the help of suitable diagrams, explain how the age structures det...
Text Solution
|
- With the help of suitable diagrams, explain how the age structures det...
Text Solution
|
- With the help of suitable diagrams, explain how the age structures det...
Text Solution
|
- The age structures of a population represents
Text Solution
|