A
B
C
D
Text Solution
Verified by Experts
The correct Answer is:


Topper's Solved these Questions
Similar Questions
Explore conceptually related problems
ICSE-DATA HANDLING -EXERCISE 24D
- The following table shows the favourite sports of 250 students in a sc...
Text Solution
|
- The marks obtained by a student in his annual examination in various s...
Text Solution
|
- The birth-rate per thousand of five countries over a period of time is...
Text Solution
|
- The air distances of four cities from Delhi (in km) are given below : ...
Text Solution
|
- Read the given bar graph and answer the question that follow : Wh...
Text Solution
|
- Read the given bar graph and answer the question that follow : Ho...
Text Solution
|
- Read the given bar graph and answer the question that follow : In...
Text Solution
|
- Read the given bar graph and answer the question that follow : Wh...
Text Solution
|
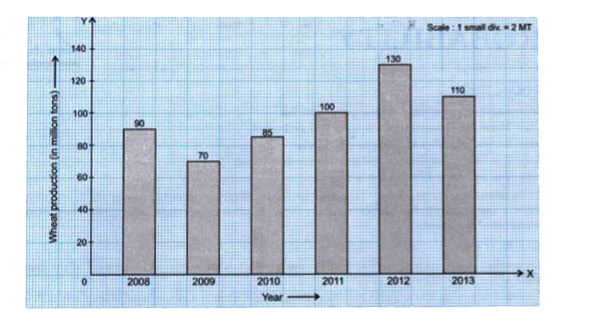
- Read the bar graph given below : What information is given by the...
Text Solution
|
- Read the bar graph given below : What was the wheat production in...
Text Solution
|
- Read the bar graph given below : In which year the production was...
Text Solution
|
- Read the bar graph given below : In which year there was maximum ...
Text Solution
|
- Read the bar graph given below : Find the percentage increase in ...
Text Solution
|