


Topper's Solved these Questions
STUDY OF ACIDS, BASES AND SALTS
ICSE|Exercise WORKSHEET-5|19 VideosSTUDY OF ACIDS, BASES AND SALTS
ICSE|Exercise Additional Questions for Practice|41 VideosSTUDY OF ACIDS, BASES AND SALTS
ICSE|Exercise WORKSHEET-3|17 VideosSPECIMEN QUESTION PAPER (CHEMISTRY)
ICSE|Exercise Questions|40 VideosSTUDY OF COMPOUNDS - AMMONIA
ICSE|Exercise UNIT TEST PAPER 7B - AMMONIA |22 Videos
Similar Questions
Explore conceptually related problems
ICSE-STUDY OF ACIDS, BASES AND SALTS-WORKSHEET-4
- Match the following salts with their examples :
Text Solution
|
- Write the formula for : Bleaching powder : ..........
Text Solution
|
- Write the formula for : copper chloride: ....................
Text Solution
|
- Write the formula for : Potash alum : ...............
Text Solution
|
- Write the formula for : Potassium ferrocyanide : ...........
Text Solution
|
- Write the formula for : Sodium bisulphate : ..............
Text Solution
|
- Give the effect of litmus on the following salts : (Use hydrolysis mec...
Text Solution
|
- Give the effect of litmus on the following salts : (Use hydrolysis mec...
Text Solution
|
- Give the effect of litmus on the following salts : (Use hydrolysis mec...
Text Solution
|
- Give the effect of litmus on the following salts : (Use hydrolysis mec...
Text Solution
|
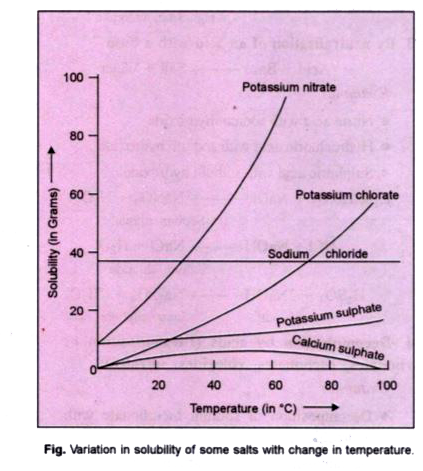
- On the basis of graph shown answer the following questions : A s...
Text Solution
|
- On the basis of graph shown answer the following questions : A sa...
Text Solution
|
- On the basis of graph shown answer the following questions : A sa...
Text Solution
|