Text Solution
Verified by Experts
The correct Answer is:


Topper's Solved these Questions
Similar Questions
Explore conceptually related problems
ICSE-MODEL TEST PAPER -3-Section B
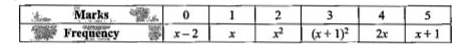
- There are 60 students in a class. The followng is the frequency distri...
Text Solution
|
- Construct truth table for (p rArr q) A (q rArr p)
Text Solution
|
- Find the values of k so that the line 2x + y + k = 0 may touch the hy...
Text Solution
|
- Find the equation of parabola with its axis parallel to x-axis and pas...
Text Solution
|
- Find the centre, foci and the equations of the directrices of the ell...
Text Solution
|
- What is the geometrical significance of x-coordinate of a point in sp...
Text Solution
|
- Find the equation of locus or a point whose distance from y-axis is eq...
Text Solution
|
- Find the equation of the parabola whose focus and vertex are (5,3) and...
Text Solution
|