Home
Class 11
MATHS
The distribution of masses to the neares...

The distribution of masses to the nearest kg, of 90 men is shown in the following table:

Find `Q_(1)` class.

Text Solution

Verified by Experts

The correct Answer is:
`Q_(1)` Class is 58.5-67.5
Promotional Banner

Topper's Solved these Questions

  • MODEL TEST PAPER -3

    ICSE|Exercise Section A |21 Videos
  • MODEL TEST PAPER -3

    ICSE|Exercise Section B |7 Videos
  • MODEL TEST PAPER -3

    ICSE|Exercise SECTION -B|10 Videos
  • MODEL TEST PAPER -2

    ICSE|Exercise Section C |8 Videos
  • MODEL TEST PAPER -4

    ICSE|Exercise SECTION -C|10 Videos

Similar Questions

Explore conceptually related problems

The distribution of masses, to the nearest kg of 90 men is shown in the following table: Find Modal Class.

The ages of 37 students in a class are given in the following table: Find the median

Ages of 20 Students Enrolled in a College Class The table above shows the distribution of ages of the 20 students enrolled in a college class. Which of the following gives the correct order of the mean, median, and mode of the ages?

For the following distribution the modal class is

From the frequency distribution table from the following data

The acceleration of the 10 kg mass block shown in the figure is : -

Find out the standard deviation from the following distribution table:

Write the median class of the following distribution:

The weights of a coffee in 70 jars are shown in the following table . .Determine variance and standard deviation of the above distribution.

The following distributions represent the height of 160 studens of a class : Find the modal height

ICSE-MODEL TEST PAPER -3-SECTION C
  1. A particle just clears a wall of height b at distance a and strikes...

    Text Solution

    |

  2. 25th percentile is 20 and 75th percentile is 50, then semi interquarti...

    Text Solution

    |

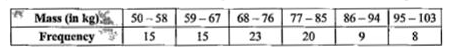
  3. The distribution of masses to the nearest kg, of 90 men is shown in th...

    Text Solution

    |

  4. The price index of a commodity is 99. What does it indicate about the ...

    Text Solution

    |

  5. Let 40% of employees earn more than Rs. 18000 per month. Then to find ...

    Text Solution

    |

  6. Compute Q(1) and Q(3) from the following data:

    Text Solution

    |

  7. Find D(8) and P(40) from the following distribution:

    Text Solution

    |

  8. The rainfall and the output of wheat per acre for a firm are as follow...

    Text Solution

    |

  9. The final positions of twelve clubs in a football league and the avera...

    Text Solution

    |

  10. The following is a record of the rquarterly electrickty bill for 3 yea...

    Text Solution

    |

  11. The standard deviation of the numbers 2, 3, 11, x is 3(1)/(2) , find t...

    Text Solution

    |

  12. Find rho (x,y) if Cav(x,y) = - 16.5 var (x) = 2.25 and sigma(y) = 12

    Text Solution

    |

  13. Index number for the total cost of raw materials used for the manufac...

    Text Solution

    |

  14. Calculate Karl Pearson's coefficient of correlation between the height...

    Text Solution

    |

  15. {:("Marks in Mathematics ", 15, 18, 21, 24, 27, 30, 36, 39, 42, 48),("...

    Text Solution

    |

  16. Find the mode of the following distribution {:("Marks ", 10-20, 2...

    Text Solution

    |

  17. An analysis of daily wages of casual labourers in two firms A and B...

    Text Solution

    |

  18. The table given below shows the number of visitors (in hundreds) to a ...

    Text Solution

    |