Text Solution
Verified by Experts
The correct Answer is:


Topper's Solved these Questions
Similar Questions
Explore conceptually related problems
ICSE-MODEL TEST PAPER - 7-Section - C
- The demand function for a certain product is represented by p = 200 + ...
Text Solution
|
- If C (x) = a + bx + cx^2 , Verify that (d)/(dx) (AC) = (1)/(x) (MC -...
Text Solution
|
- A house wife wishes to mix together two kinds of foot F(1) and F(2) in...
Text Solution
|
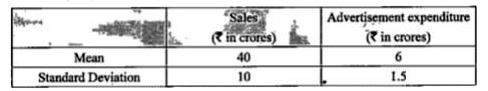
- The following table shows the sales and advertisement expenditure of...
Text Solution
|
- Treating x as dependent variable, find the line of best fit for the fo...
Text Solution
|