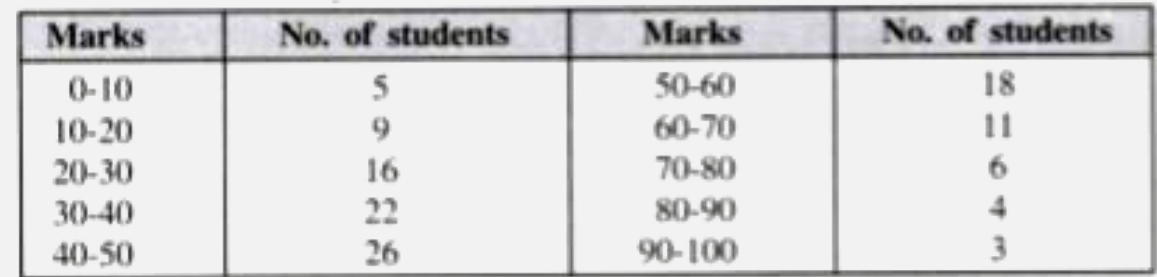
The marks obtained by 120 students in a Mathematics test are given below: Using the informations, given above, draw an ogive on a graph sheet. Take a suitable scale for your ogive. Use the ogive drawn to estimate : (i) the median. (ii) the number of students who obtained more than 75% marks in the test. (iii) the number of students who did not pass in the test if the pass percentage was 40.
Text Solution
Verified by Experts
The correct Answer is:
52 students
Topper's Solved these Questions
REVISION PAPER -2
ICSE|Exercise SECTION B|1 Videos
REVISION PAPER -1
ICSE|Exercise SECTION B|25 Videos
REVISION PAPER -3
ICSE|Exercise SECTION - B|22 Videos
Similar Questions
Explore conceptually related problems
The marks obtained by 100 students in a Mathematics test are given below : Draw an ogive for the given distribution on a graph sheet. (Use a scale of 2 cm = 10 units on both axis). Use the ogive to estimate the : (i) median.
The marks obtained by 100 students in a Mathematics test are given below : Draw an ogive for the given distribution on a graph sheet. (Use a scale of 2 cm = 10 units on both axis). Use the ogive to estimate the : (ii) lower quartile.
The marks obtained by 120 styudents in a test are given below : Draw an ogive for the given distribution on a graph sheet Use suitable scale for ogive to estiamte the following : (i) The number of students who obtained more than 75% marks in the test.
The marks obtained by 120 styudents in a test are given below : Draw an ogive for the given distribution on a graph sheet Use suitable scale for ogive to estiamte the following : (i) The median.
The marks obtained by 100 students in a Mathematics test are given below : Draw an ogive for the given distribution on a graph sheet. (Use a scale of 2 cm = 10 units on both axis). Use the ogive to estimate the number of students who obtained more than 85% marks in the test.
The marks obtained by 100 students in a Mathematics test are given below : Draw an ogive for the given distribution on a graph sheet. (Use a scale of 2 cm = 10 units on both axis). Use the ogive to estimate the number of students who did not pass in the test if the pass percentage was 35.
The marks obtained by 120 styudents in a test are given below : Draw an ogive for the given distribution on a graph sheet Use suitable scale for ogive to estiamte the following : (iii) The number of students who did not pass the test if minimum marks required to pass is 40.
The marks obtained (out of 100) by 400 students in an examination are given below: Using a graph paper, draw an ogive for the above distribution. Use ogive to estimate the following: estimate the number of students who obtained more than 80% marks in the examination.
Use graph paper for this question. The amrks obtained by 120 students in an English test are given below : Draw the ogive and hence, estimate : the number of students who did not pass test if the pass percetage was 50.
The marks obtained (out of 100) by 400 students in an examination are given below: Using a graph paper, draw an ogive for the above distribution. Use ogive to estimate the following: estimate the median.