Home
Class 7
MATHS
Read the following graph and answer the ...

Read the following graph and answer the following question.
Find the ratio of the number of shirts of size 38 sold to the number of shirts of size 42 sold.

Text Solution

Verified by Experts

The correct Answer is:
40:60
Promotional Banner

Topper's Solved these Questions

  • DATA HANDLING AND MEASURES OF CENTRAL TENDENCY

    ICSE|Exercise EXERCIES 18.1|37 Videos
  • DATA HANDLING AND MEASURES OF CENTRAL TENDENCY

    ICSE|Exercise EXERCIES 18.2|16 Videos
  • CONSTRUCTIONS

    ICSE|Exercise REVISION EXERCISE |12 Videos
  • DATA HANDLING

    ICSE|Exercise EXERCISE 24D|13 Videos

Similar Questions

Explore conceptually related problems

Read the following graph and answer the following question. What are the different sizes of shirts that are sold?

Read the bar graph and answer the following questions. What information is given by the bar graph?

Following is a bar graph giving the approximate heights of five mountain peaks. Read the graph and answer the following questions. Find the ratio of the height of the highest peak to that of the lowest peak.

Read the bar graph and answer the following questions. in which year the value of the export is greater than that of the import?

Read the bar graph and answer the following questions. In which year the difference of the values of export and import is maximum?

How many shirt of size 40 were sold?

The following bar graph represents the data for different sizes of shoes worn by the students in a school. Read the graph and answer the following questions. (i)What are the different numbers of the shoe-worn by the students? (ii)What is the number of students wearing shoe No. 6? (iii)Which shoe number is worn by the maximum number of students? (iv)Which shoe number is worn by the minimum number of students?

Read the following bar graph (Figure) and answer the following questions: What is the information given by the bar graph? State each of the following whether true or false. The number of government companies in 1957 is that of 1982 is 1:9. The number of government companies have decreased over the year 1957 to 1983

The given bar graph shows the number of identical articles sold by 5 different stores A, B, C, D and E during a particular month. Study the bar graph and answer the following questions : (i) Which store sold the largest number of articles ? (ii) By what per cent is the sale of store D more than that of store B ? (iii) Find the ratio of the total sale of the two highest selling stores to the total sale of the two least selling stores. (iv) By how much must store E increase its sale to catch up with its nearest rival store ?

Read the following bar graph and answer the following questions: What information is given by the bar graph? In which year the export is minimum ? In which year the import is maximum ? In which year the difference of the values of export and import is maximum?

ICSE-DATA HANDLING AND MEASURES OF CENTRAL TENDENCY-TRY THIS
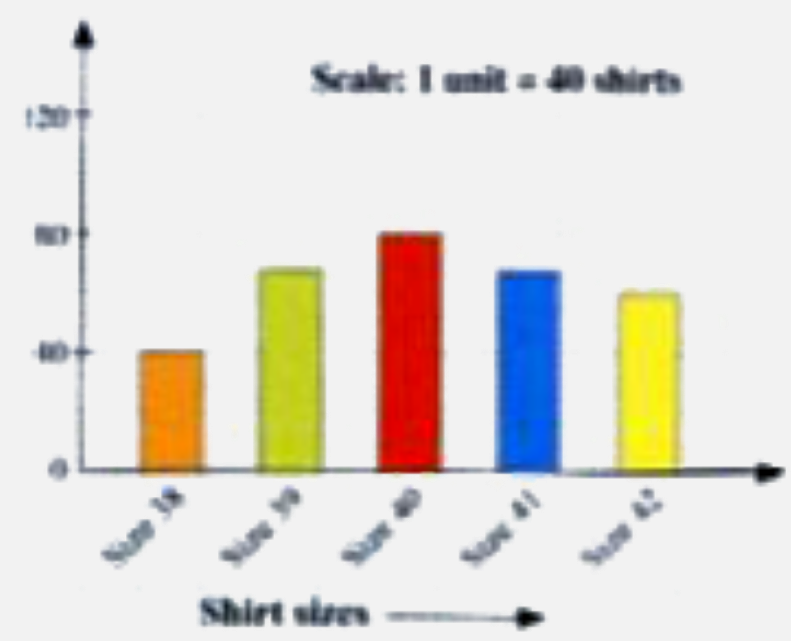
  1. Read the following graph and answer the following question. Find th...

    Text Solution

    |

  2. A school has wants to arrange hobby classes for the students of classe...

    Text Solution

    |

  3. The number of hours Ashu studied on different days of a week are as fo...

    Text Solution

    |

  4. The weights of 10 students in a class are: 35 kg; 27 kg;36 kg;30 kg;29...

    Text Solution

    |

  5. Create a set of 6 observation with mean 8.

    Text Solution

    |

  6. Find the sum of 12 numbers whose mean is 11.

    Text Solution

    |

  7. The mean of 9 numbers is 10. If one more number is added, the mean re...

    Text Solution

    |

  8. The mean of 5 consecutive multiples of 7 is 28. Find the sum of 2nd an...

    Text Solution

    |

  9. The mean of numbers is 25, seven of these 10 numbers are 13,14,15,16,1...

    Text Solution

    |

  10. Find the median of the data: 38,42,35,45,50,32,43,40,36,38,43,38,47,

    Text Solution

    |

  11. Find the median of the data: 17,16,12,14,14,16,17,22,15,17,16,18

    Text Solution

    |

  12. The median of 8 numbers is 40. If 7 of these numbers are 22,58,31,44,2...

    Text Solution

    |

  13. A data set has 13 distinct observation with median 18. If one more num...

    Text Solution

    |

  14. Find the mode of the following data. 3,7,4,5,9,1,7,2,2,8,1,2,4,7,7,1...

    Text Solution

    |

  15. The number of children in 20 famiies were found are noted as follows, ...

    Text Solution

    |

  16. Find the mode of the following data: 23,29,41,48,25,28,47

    Text Solution

    |

  17. Following are the number of goals scored by a football team in differe...

    Text Solution

    |

  18. The number of challans that are issued per day by the traffic police f...

    Text Solution

    |

  19. Following is a data sample of 8 observations in ascending order. If th...

    Text Solution

    |

  20. The runs scored by a batsman in 2 different cricket matches are as fol...

    Text Solution

    |