Text Solution
Verified by Experts
The correct Answer is:


Topper's Solved these Questions
DATA HANDLING AND MEASURES OF CENTRAL TENDENCY
ICSE|Exercise WARM-UP EXERCISE|5 VideosDATA HANDLING AND MEASURES OF CENTRAL TENDENCY
ICSE|Exercise TRY THIS|19 VideosDATA HANDLING AND MEASURES OF CENTRAL TENDENCY
ICSE|Exercise EXERCIES 18.2|16 VideosCONSTRUCTIONS
ICSE|Exercise REVISION EXERCISE |12 VideosDATA HANDLING
ICSE|Exercise EXERCISE 24D|13 Videos
Similar Questions
Explore conceptually related problems
ICSE-DATA HANDLING AND MEASURES OF CENTRAL TENDENCY-REVISION EXERCISE
- Following is the number of children in 28 families ofa colony. 1, 2...
Text Solution
|
- The hourly wages of 8 people are as follows. Rs 200. Rs 150, Rs 50, ...
Text Solution
|
- Which central tendency has been used to arrive at the following statem...
Text Solution
|
- Which central tendency has been used to arrive at the following statem...
Text Solution
|
- Which central tendency has been used to arrive at the following statem...
Text Solution
|
- Which central tendency has been used to arrive at the following statem...
Text Solution
|
- Which central tendency has been used to arrive at the following statem...
Text Solution
|
- Which central tendency has been used to arrive at the following statem...
Text Solution
|
- Which central tendency has been used to arrive at the following statem...
Text Solution
|
- Following are the observations of a data sample in ascending order. If...
Text Solution
|
- Following table represents the lengths of six different ribbons. f...
Text Solution
|
- Following table represents the lengths of six different ribbons. ...
Text Solution
|
- Following table represents the lengths of six different ribbons. f...
Text Solution
|
- Following table represents the lengths of six different ribbons. f...
Text Solution
|
- Following is a bar graph giving the approximate heights of five mounta...
Text Solution
|
- Following is a bar graph giving the approximate heights of five mounta...
Text Solution
|
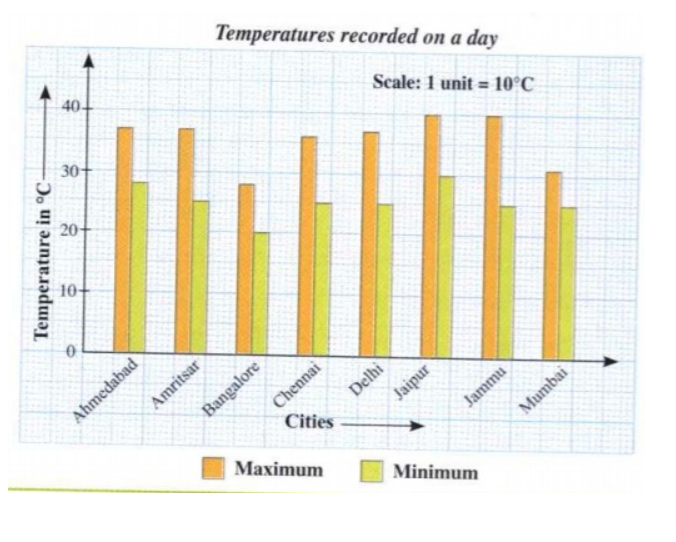
- The following graph gives the minimum and maximum temperatures of vari...
Text Solution
|
- The following graph gives the minimum and maximum temperatures of vari...
Text Solution
|
- The following graph gives the minimum and maximum temperatures of vari...
Text Solution
|
- The following graph gives the minimum and maximum temperatures of vari...
Text Solution
|