


Similar Questions
Explore conceptually related problems
Recommended Questions
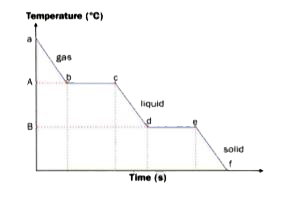
- Look at the change of state diagram from gas to solid given here caref...
Text Solution
|
- Suppose a diatomic gas gets ionised to a certain extent without any ex...
Text Solution
|
- The amount of heat required to change a liquid to gaseous state withou...
Text Solution
|
- Amount of energy required to change liquid to gas and vice versa witho...
Text Solution
|
- Amount of energy required to change liquid to gas and vice versa witho...
Text Solution
|
- Study temperature -time graph given below: The graph shows heating of ...
Text Solution
|
- Suppose a diatomic gas gets ionised to a certain extent without any ex...
Text Solution
|
- Quantity of heat required to change state of unit masssubstance withou...
Text Solution
|
- Is it possible to change the temperature of a gas without supplying he...
Text Solution
|