


Topper's Solved these Questions
Similar Questions
Explore conceptually related problems
NAVNEET PUBLICATION - MAHARASHTRA BOARD-BAR GRAPHS-QUESTION BANK
- This bar graph shows the temperatures in degree Celsius in different c...
Text Solution
|
- This bar graph shows the temperatures in degree Celsius in different c...
Text Solution
|
- This bar graph shows the temperatures in degree Celsius in different c...
Text Solution
|
- This bar graph shows the temperatures in degree Celsius in different c...
Text Solution
|
- This bar graph shows the temperatures in degree Celsius in different c...
Text Solution
|
- The names of the heads of some families in village and the quantity of...
Text Solution
|
- The names and numbers of animals in a certain zoo are given below. Use...
Text Solution
|
- The table below gives the number of students who took part in the vari...
Text Solution
|
- The Number of Customers Who Came to a Juice Centre for One Week is Giv...
Text Solution
|
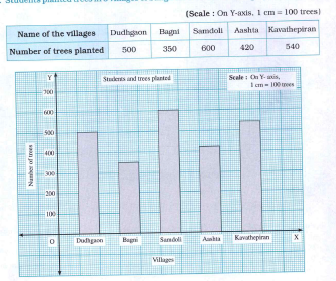
- Students planted trees in 5 villages of Sangli district. Make a bar gr...
Text Solution
|
- Yeshwant allocates different duration of time as shown below, to diffe...
Text Solution
|