


Topper's Solved these Questions
Similar Questions
Explore conceptually related problems
ICSE-DATA HANDLING -EXERCISE 22 (B)
- Hundred students from a certain locality use different modes of travel...
Text Solution
|
- Mr. Mirza's monthly income is रु 7,200 . He spends. रु 1,800 on rent र...
Text Solution
|
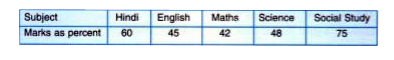
- The percentage of marks obtained, in different subjects by Ashok Sharm...
Text Solution
|
- The following table shows the market position of different brands of t...
Text Solution
|
- Students of a small school use different modes of travel to school as ...
Text Solution
|
- For the following table, draw a bar-graph
Text Solution
|
- Manoj appeared for ICSE examination 2018 and secured percentage of mar...
Text Solution
|
- For the data given above in question number 7, draw a suitable pie-gra...
Text Solution
|
- Mr. Kapoor compares the prices (in) of different items at two differen...
Text Solution
|
- The folliwng table shows the mode of transport used by boys and girls ...
Text Solution
|