Text Solution
Verified by Experts
The correct Answer is:


Topper's Solved these Questions
Similar Questions
Explore conceptually related problems
ICSE-GRAPHICAL SOLUTION(SOLUTION OF SIMULTANEOUS LINEAR EQUATIONS, GRAPHICALLY)-EXAMPLES
- Draw the graph of y=3x-4
Text Solution
|
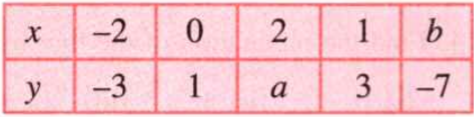
- Use the table given alongside to draw the graph. Use the graph drawn t...
Text Solution
|
- On a graph paper, draw a straight line represented by the equation 2x-...
Text Solution
|
- Solve the given equations graphically. 3x-2y=4 and 5x-2y=0
Text Solution
|
- Use graph paper for this question: (i) Draw the graphs of 3x-y-2=0 an...
Text Solution
|
- In a factory the cost of manufacturing x articles is Rs. (20+2x) and t...
Text Solution
|