Home
Class 12
PHYSICS
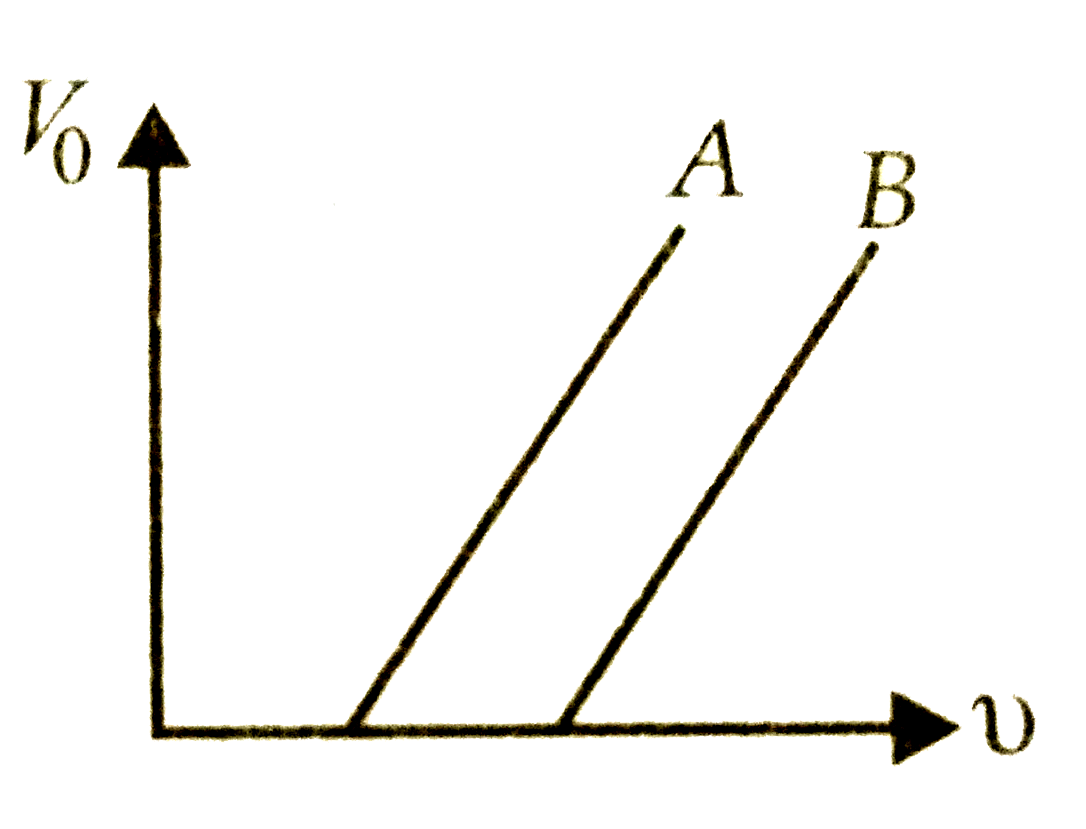
The figure shows stopping potential V(0)...

The figure shows stopping potential `V_(0)` and frequency v for two different metallic surfaces A and B. The work function of A, as compared to that of B is

Promotional Banner

Similar Questions

Explore conceptually related problems

The stopping potential (V_(0))

The graph between the stopping potential V_(0) and frequency v for two different metal plates P and Q are shown in the figure. Which of the metals has greater threshold wavelength and work function.

Graph between stopping potential and frequency of photon is given in figure Find out work function of metal:

The figure shows different graphs between stopping potential (V_(0)) and frequency (v) for photosensitive surface of cesium , potassium , sodium and lithium. The plots are parallel. Correct ranking of the targets according to their work function greatest forst will be

Figure shows the graph of stopping potential verus that frequency of a photosensitive metal. The plank's constant and work funcation of the metal are

The stopping potential as a function of frequency of incident radiation is plotted for two different photoelectric surfaces A and B . The graphs as shown in figure shows that , the work function of A is

The graph shows variation of stopping potential V_(0) versus frequency of incident radiation v for two photosensitive metals A and B . Which of two metals has higher threshold frequency and why?

Draw a graph between stopping potential and the frequency of two metals A and B having threshold frequencies v_0 and 2v_0 .

The stopping potential V_(0) (in volt) as a function of frequency (v) for a sodium emitter, is shown in the figure. The work function of sodium, from the data plotted in the figure, will be: (Given : Planck’s constant) (h) = 6.63 xx10^(-34)Js" electron charge "e=1.6xx10^(-19)C )