Text Solution
Verified by Experts
The correct Answer is:


Topper's Solved these Questions
Similar Questions
Explore conceptually related problems
ICSE-RELATIONS AND FUNCTIONS-EXERCISE 2 (g)
- A sketch of the graph y=alog(4)(x+b) is shown. Find the values of a an...
Text Solution
|
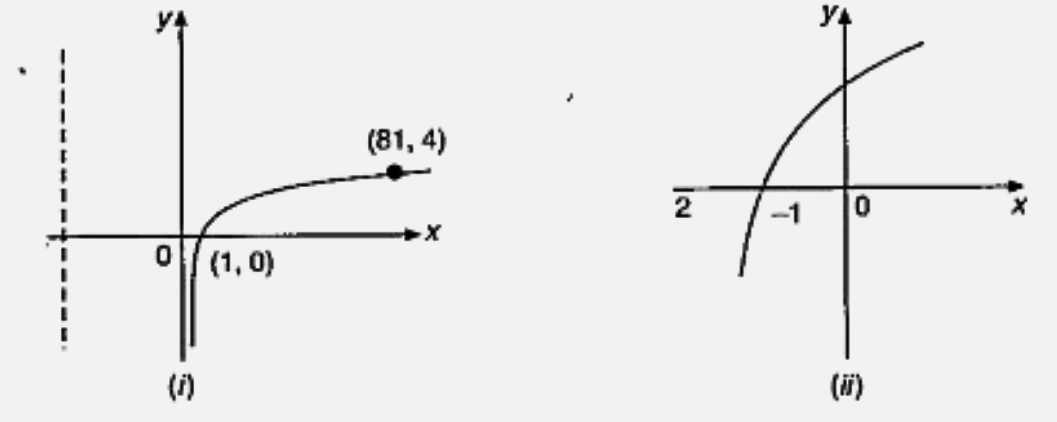
- Diagram (i) shows the curve y=log(a)x. What is the value of a? .
Text Solution
|
- Diagram (ii) shows the curve y=log(10)(x+p). What is the value of p?
Text Solution
|
- Sketch the graphs y=2 and y=log(10)2x on the same diagram.
Text Solution
|
- Find the point of intersection of the graphs by solving the equation l...
Text Solution
|
- The sketch shows part of the graph y=alog(2)(x-b). Find the values of ...
Text Solution
|
- Sketch the graphs y=4-x and y=log(10)x on the same diagram.
Text Solution
|
- (i)sketch the graph y=4-x and y= log(10)x on same graph . (ii) write...
Text Solution
|
- Sketch the graphs y=4-x and y=log(10)x on the same diagram.
Text Solution
|
- Sketch the graphs y=4-x and y=log(10)x on the same diagram.
Text Solution
|
- Sketch the graphs. y=log(2)x
Text Solution
|
- Sketch the graphs. y=log(2)x+1
Text Solution
|
- Sketch the graphs. y=log(2)(x+1)
Text Solution
|
- Sketch the graphs. log(4)x
Text Solution
|
- Sketch the graphs. 2log(4)x
Text Solution
|
- Sketch the graphs. 3log(4)x
Text Solution
|
- For -2ltxlt1, draw the graph of y=2^(x) (use 1 cm =1 unit on both axes...
Text Solution
|
- Complete the following table for y=4^(x). Enter the values of x and y ...
Text Solution
|
- Taking 4 cm =1 unit on both axes, draw the graph of y=4^(x) for 0.75ge...
Text Solution
|
- From your graph estimate log(4)1.25
Text Solution
|