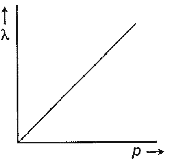
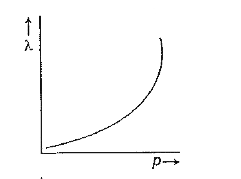
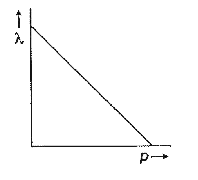
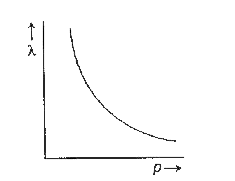
Home
Class 12
PHYSICS
Which one of the following graphs in fol...

Which one of the following graphs in following figure represents variation of de Broglie wavelength `(lamda)` of a particle having linear

A

B

C

D

Text Solution

AI Generated Solution

The correct Answer is:
To solve the question regarding the variation of de Broglie wavelength (λ) of a particle with linear momentum (p), we can follow these steps: ### Step 1: Understand the de Broglie Hypothesis According to the de Broglie hypothesis, the relationship between the momentum (p) of a particle and its wavelength (λ) is given by the equation: \[ p = \frac{h}{\lambda} \] where \( h \) is the Planck constant. ### Step 2: Rearranging the Equation We can rearrange the equation to express the wavelength in terms of momentum: \[ \lambda = \frac{h}{p} \] This shows that the wavelength is inversely proportional to the momentum. ### Step 3: Analyzing the Relationship From the equation \( \lambda = \frac{h}{p} \), we can see that as the momentum \( p \) increases, the wavelength \( \lambda \) decreases. This indicates a hyperbolic relationship between \( p \) and \( \lambda \). ### Step 4: Graphical Representation The graph of \( p \) versus \( \lambda \) will resemble the shape of the function \( y = \frac{1}{x} \), which is a hyperbola. Specifically, as \( p \) increases, \( \lambda \) approaches zero, and as \( p \) approaches zero, \( \lambda \) increases indefinitely. ### Step 5: Identifying the Correct Graph In the provided options, we need to identify the graph that represents this hyperbolic relationship. The correct graph will show a curve that decreases as it moves to the right, indicating that as momentum increases, the wavelength decreases. ### Conclusion Based on the analysis, the correct option that represents the variation of de Broglie wavelength (λ) with linear momentum (p) is option 4. ---
Promotional Banner

Similar Questions

Explore conceptually related problems

Which of the following graphs correctly represents the variation of g on the - Earth?

The de Broglie wavelength associated with particle is

Which of following graphs correctly represents the variation of particle momentum with de-Broglie wavelength?

Which one of the following graphs represent a function? (FIGURE)

Which of the following graphs best represents the variation of acceleration 'a' with displacement x?

Which one of the following graphs represent a one-one function? (FIGURE)

Which one of the following graphs represents variation of specific heat capacity of water with temperature?

Which of the following figure represents the variation of particle momentum and the associated de - Broglie wavelength ?

Which of the following graphs cannot possibly represent one dimensional motion of a particle. .

Which of the following graphs cannot possibly represent one dimensional motion of a particle?