Text Solution
Verified by Experts


Similar Questions
Explore conceptually related problems
Recommended Questions
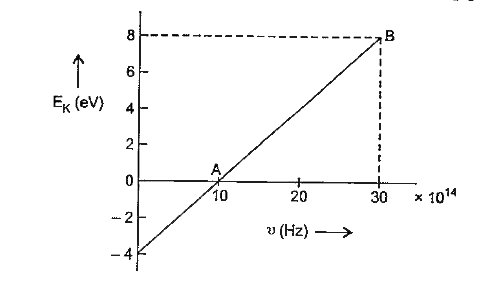
- In an experiment of photo-electric effect, the graph of maximum kineti...
Text Solution
|
- Light of frequency 4 v(0) is incident on the metal of the threshold fr...
Text Solution
|
- The photoelectric threshold frequency of a metal is v0. When ligth of ...
Text Solution
|
- The photoelectric threshold frequency of a metal is v. When light of f...
Text Solution
|
- For photoelectric effect, the graph of the maximum kinetic energy K of...
Text Solution
|
- The photoelectric threshold frequency of a metal is v0. When ligth of ...
Text Solution
|
- The maximum kinetic energy of emitted photoelectrons against frequency...
Text Solution
|
- किसी धातु की प्रकाशविद्युत देहली आवृत्ति v है। जब 4v आवृत्ति का प्रका...
Text Solution
|
- Given below is the graph between frequency (v) of the incident light a...
Text Solution
|