Text Solution
Verified by Experts


Similar Questions
Explore conceptually related problems
Recommended Questions
- In an experiment of photo-electric effect, the graph of maximum kineti...
Text Solution
|
- The stopping potential in an experiment on a photo electric effect is ...
Text Solution
|
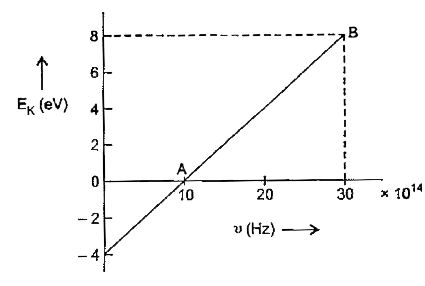
- The maximu kinetic energy (E(k)) of the photoelectron varies with freq...
Text Solution
|
- प्रकाश - विधुत उत्सर्जन के प्रयोग में किसी धातु तल से उत्सर्जित फोट...
Text Solution
|
- Figure represents the graph of photo current I versus applied ...
Text Solution
|
- The photoelectric threshold frequency of a metal is v. When light of f...
Text Solution
|
- The stopping potential in an experiment on a photo electric effect is ...
Text Solution
|
- The stopping potential in an experiment on a photo electric effect is ...
Text Solution
|
- The maximum kinetic energy of emitted photoelectrons against frequency...
Text Solution
|