Home
Class 12
PHYSICS
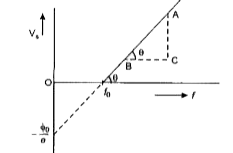
(i) Plot a labelled graph of |V(s)| wher...

(i) Plot a labelled graph of `|V_(s)|` where `V_(s)` is stopping potential versus frequency f of the incident radiation.
(ii) State how will you use this graph to determine the value of Planck.s constant.

Text Solution

Verified by Experts

The graph of stopping potential, `| V_S|` versus frequency, f of incident radiation is given below:
Promotional Banner

Similar Questions

Explore conceptually related problems

The slope of the graph drawn between stopping potential and frequency of incident radiation will be

Plot a labelled graph of maximum kinetic energy of photo electrons versus frequency of incident radiation. State how you will obtain the value of Planck.s constant h from the graph.

The stopping potential as a function of the frequency of the incident radiation is plotted for two different photoelectric surfaces A and B . The graphs show that work function of A is

The variation of photocurrent with collector potential for different frequencies of incident radiation v_1,v_2,v_3 is as shown in the the graph , then

The graph shows variation of stopping potential V_(0) versus frequency of incident radiation v for two photosensitive metals A and B . Which of two metals has higher threshold frequency and why?

When a high frequency electromagnetic radiation is incident on a metallic surface, electrons are emitted from the surface. Energy of emitted photoelectrons depends only on the frequency of incident electromagnetic radiation and the number of emitted electrons depends only on the intensity of incident light. Einstein's protoelectron equation [K_(max)=hv-phi] correctly ecplains the PE, where upsilon= frequency of incident light and phi= work function. Q. For photoelectric effect in a metal, the graph of the stopping potential V_0 (in volt) versus frequency upsilon (in hertz) of the incident radiation is shown in Fig. The work function of the metal (in eV) is.

Explain giving reasons for the following : (a) Photoelectric current in a photocell increases with the increase in intensity of the incident radiation. (b) The stopping potential V_0 varies linearly with the frequency nu of the incident radiation for a given photosensitive surface with the slope remaining the same for different surfaces. (c) Maximum kinetic energy of the photoelectrons is independent of the intensity of incident radiation.

In photoelectric effect experiment, the slope of the graph of the stopping potential versus frequency gives the value of :

In photoelectric effect the slope of straight line graph between stopping potential (V_(s)) and frequency of incident light (v) gives

State Ohm's law. Draw a labelled circuit diagram to verify this law in the laboratory. If you draw a graph between the potential difference and current flowing through a metallic conductor, what kind of curve will you get? Explain how would you use this graph to determine the resistance of the conductor.