Home
Class 10
BIOLOGY
The figure given below represents an exp...

The figure given below represents an experimental setup with a weighing machine to demonstrate a particular process in plants. The experimental set -up was placed in bright sunlight. Study the diagram and answer the following questions :

When the weight of the test tube (A & B) is taken before and after the experiment, what is observed? Give reasons to justify your observation in A & B.

Text Solution

Verified by Experts

Weight of test tube A will decrease after the experiment because water will be lost from it through the leaves by transpiration. Weight of test tube B will remain same after the experiment because water will not be lost by transpiration as there is no plant in it and nor by evaporation as oil is spread over it, which will not allow evaporation.
Promotional Banner

Topper's Solved these Questions

  • SAMPLE PAPER 2014

    ICSE|Exercise SECTION-I (CHOOSE THE CORRECT ANSWER)|5 Videos
  • SAMPLE PAPER 2014

    ICSE|Exercise SECTION-II|72 Videos
  • SAMPLE PAPER 2013

    ICSE|Exercise SECTION-II|56 Videos
  • SAMPLE PAPER 2015

    ICSE|Exercise SECTION-II|63 Videos

Similar Questions

Explore conceptually related problems

The figure given below represents an experimental setup with a weighing machine to demonstrate a particular process in plants. The experimental set -up was placed in bright sunlight. Study the diagram and answer the following questions : Name the process intended for study.

The figure given below represents an experimental setup with a weighing machine to demonstrate a particular process in plants. The experimental set -up was placed in bright sunlight. Study the diagram and answer the following questions : What is the purpose of keeping the test tube Bin the experimental set-up?

The diagram below represents a process in plants. The setup was placed in bright sunlight. Answer the following questions : Explain the term 'Guttation'

Study the set-up given in the diagram and answer the following questions: What will be the level in tube A and tube B after 1 hour of set-up?

Given below is an experimental setup to demonstrate a particular process in animals. Answer the questions that follow: What is the function of soda lime?

The diagram given below represents an experimental set-up to demonstrate a vital process. Study the same and then answer the questions that follow : Name the process.

The diagram given below represents an experimental set-up to demonstrate a vital process. Study the same and then answer the questions that follow : Name the process.

The diagram below represents a process in plants. The setup was placed in bright sunlight. Answer the following questions : Mention any three adaptations found in plants to overcome this process?

The following diagram demonstrates a physiological process taking place in green plants. The whole set up was placed in bright sunlight for several hours. Study the diagram and answer the questions that follow: Label the parts numbered 1 and 2in the diagram.

The following diagram demonstrates a physiological process taking place in green plants. The whole set up was placed in bright sunlight for several hours. Study the diagram and answer the questions that follow : Label the parts numbered 1 and 2 in the diagram.

ICSE-SAMPLE PAPER 2014-SECTION-II
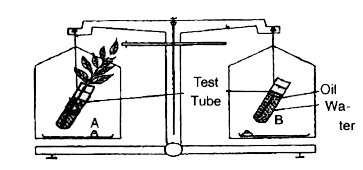
  1. The figure given below represents an experimental setup with a weighin...

    Text Solution

    |

  2. Spinal and Cranial nerves

    Text Solution

    |

  3. With reference to the functioning of the eye, answer the questions tha...

    Text Solution

    |

  4. Differentiate between : Corpus callosum and Corpus luteum (Functi...

    Text Solution

    |

  5. Differentiate between the following pairs on the basis of what is ment...

    Text Solution

    |

  6. Differentiate between the following pairs on the basis of what is ment...

    Text Solution

    |

  7. The diagram given below represents the simplified pathway of the circu...

    Text Solution

    |

  8. The diagram below represents the simplified pathway of the circulation...

    Text Solution

    |

  9. The diagram given below represents the simplified pathway of the circu...

    Text Solution

    |

  10. The diagram below represents the simplified pathway of the circulation...

    Text Solution

    |

  11. The diagram below represents the simplified pathway of the circulation...

    Text Solution

    |

  12. A candidate in order to study the process of osmosis has taken 3 potat...

    Text Solution

    |

  13. A candidate in order to study the process of osmosis has taken 3 potat...

    Text Solution

    |

  14. A candidate in order to study the process of osmosis has taken 3 potat...

    Text Solution

    |

  15. A candidate in order to study the process of osmosis has taken 3 potat...

    Text Solution

    |

  16. A candidate in order to study the process of osmosis has taken 3 potat...

    Text Solution

    |

  17. A candidate in order to study the importance of certain factors in pho...

    Text Solution

    |

  18. A potted plant with variegated leaves was taken in order to prove a fa...

    Text Solution

    |

  19. A healthy Croton plant bearing variegated leaves was kept in a dark cu...

    Text Solution

    |

  20. A potted plant with variegated leaves was taken in order to prove a fa...

    Text Solution

    |

  21. A potted plant with variegated leaves was taken in order to prove a fa...

    Text Solution

    |