


Topper's Solved these Questions
Similar Questions
Explore conceptually related problems
R G PUBLICATION-MOTION-EXAMPLE
- A ball is gently dropped from a height of 20 m. If its velocity increa...
Text Solution
|
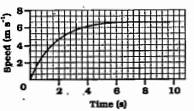
- The speed time graph for a car is shown in the figure. find how f...
Text Solution
|
- The speed time graph for a car is shown in the figure. Which part...
Text Solution
|
- An artificial satellite is moving in a circular orbit of radius 42250 ...
Text Solution
|
- Which one is scalar quantity.
Text Solution
|
- What is the S.I. unit of speed?
Text Solution
|
- Rate of change of displacment is known as-
Text Solution
|
- If the distance travelled by a body is x and its displacement is y, wh...
Text Solution
|
- Which one is a vector quantity?
Text Solution
|
- Which has no direction-
Text Solution
|
- What is the unit of acceleration-
Text Solution
|
- Retardation
Text Solution
|
- Express 12.5 m/s into km/h ?
Text Solution
|
- If a body travels 30 m in 3 see the speed of the body is
Text Solution
|
- Which relation is not correct-
Text Solution
|
- What is distance?
Text Solution
|
- Is distance a vector quantity?
Text Solution
|
- What is displacement?
Text Solution
|
- Is displacement a vector quantity?
Text Solution
|
- What it he C.G.S and S.I. unit of displacement?
Text Solution
|