A
B

C
D
Text Solution
Verified by Experts


Topper's Solved these Questions
Similar Questions
Explore conceptually related problems
KVPY PREVIOUS YEAR-MOCK TEST 10-EXERCISE
- Select the correct option regarding the phytohormone to which the give...
Text Solution
|
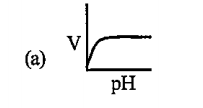
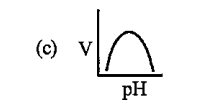
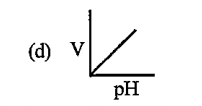
- Which one of the given graph shows the effect of pH on the velocity of...
Text Solution
|
- Which of the following types of mammalian cell does not carry out oxid...
Text Solution
|
- Blood group AB has
Text Solution
|
- One child is haemophilic (sex-linked trait), while its fraternal twins...
Text Solution
|
- One microelectrode is inserted into a healthy neuron and another is pl...
Text Solution
|
- A pasture of 40 hectareshas a biomassof 40kg hectare, or roughly 1,000...
Text Solution
|
- Jet lag occurs when a person moves rapidly from one time zone to anoth...
Text Solution
|
- Choose the sequence in which the following enzymes take part in DNA re...
Text Solution
|
- The colonies of recombinant bacteria appear white in contrast to blue ...
Text Solution
|
- The painful skin condition known as shingles is associated is associa...
Text Solution
|
- In humans, albinism is controlled by a recessive allele. How many copi...
Text Solution
|
- When an angiospermic plant of chromosomal type 'aa' pollinates another...
Text Solution
|