


Topper's Solved these Questions
Similar Questions
Explore conceptually related problems
NCERT TELUGU-COAL AND PETROLEUM-EXERCISE
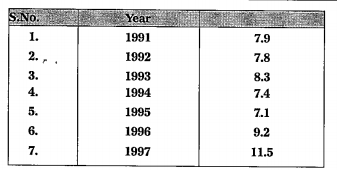
- The following table shows the total power shortage percentage in India...
Text Solution
|
- What is coal tar? How is it useful to us?
Text Solution
|
- Explain the process of formation of petrol.
Text Solution
|
- What will happen if all the forests wer cut down?
Text Solution
|
- What is the difference between destructive distillation and fractional...
Text Solution
|
- What are the harmful effects of burning fossil fuels? How it effect th...
Text Solution
|
- Why natural gas is called as ideal fuel?
Text Solution
|
- "Crude oil and refined fuel when spills into the sea from tanker of sh...
Text Solution
|
- Resources which are present in unlimited amount are called
Text Solution
|
- Natural resources which are present in limited quantity and which can ...
Text Solution
|
- Fossil fuel
Text Solution
|
- Pure form of carbon
Text Solution
|
- Coal tar is used in manufacture of
Text Solution
|
- Naphthalene balls obtained from
Text Solution
|
- Petroleum formed from
Text Solution
|
- Refining is
Text Solution
|
- Fuel in a Jet Aircraft
Text Solution
|
- The major constituent of CNG is
Text Solution
|
- Which one is ideal fuel relative to pollution?
Text Solution
|