


Topper's Solved these Questions
Similar Questions
Explore conceptually related problems
VGS PUBLICATION-BRILLIANT-STATISTICS-EXERCISE
- Consider the marks obtained by 50 students in a mathematics test for a...
Text Solution
|
- The weight (in grams) of 50 oranges, picked at random from a basket of...
Text Solution
|
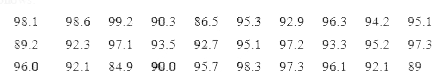
- The relative humidity (in %) of a certain City for a September month o...
Text Solution
|
- The relative humidity (in %) of a certain City for a September month o...
Text Solution
|
- The blood groups of 36 students of IX class are record as follows. A, ...
Text Solution
|
- Three coins are tossed 30 times simultaneously. Each time the number o...
Text Solution
|
- A TV channel or organised SMS (Short Message Service) poll on prohibit...
Text Solution
|
- Identify the scale used on the axes of the adjacent graph. Write the f...
Text Solution
|
- The marks 30 students of a class, obtained in a test (out of 75) , are...
Text Solution
|
- The electricity bills (in rupees) of 25 houses in a locality are given...
Text Solution
|
- A company manufactures car batteries of particular type. The life (in ...
Text Solution
|
- Give 3 situations, where mean, median and mode are separately appropri...
Text Solution
|
- Rain fall of a place in the week is 4 cm, 5 cm, 12cm, 3cm, 6cm, 8cm, 0...
Text Solution
|
- If the mean of 10, 12, 18, 13, P and 17 is 15, find the value of P.
Text Solution
|
- If the mean of the following data is 7.5 , then find the value of ‘A’ ...
Text Solution
|
- Find the median of the scores 75, 21, 56 , 36 , 81 , 05, 42
Text Solution
|
- Median of a data, arranged in ascending order 7, 10, 15, x, y, 27, 30 ...
Text Solution
|
- In finding the median, the given data must be written in order. Why ?
Text Solution
|
- The following numbers are the sizes of shoes sold by a shop in a parti...
Text Solution
|
- Classify your class mates according to their heights and find the mode...
Text Solution
|