


Topper's Solved these Questions
Similar Questions
Explore conceptually related problems
VGS PUBLICATION-BRILLIANT-STATISTICS-EXERCISE
- What will happen to the measures of central tendency if we multiply ea...
Text Solution
|
- What will happen to the mean, mode and median if each data value is mu...
Text Solution
|
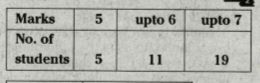
- Write the mark wise frequencies in the following frequency distributio...
Text Solution
|
- Explain inclusive classes and exclusive classes.
Text Solution
|
- Write the class boundaries of the following classes : 25-29, 30-34, 35...
Text Solution
|
- What is the lower limit of a class ? What is the upper limit of a clas...
Text Solution
|
- Write the formula for finding mean of ungrouped frequency distribution...
Text Solution
|
- Find the median marks in the data.
Text Solution
|
- There are 40 students in a class. Their average mark in English is 55....
Text Solution
|
- Information collected in the form of facts, numerical figures, tables ...
Text Solution
|
- Data collected from a source like registers is called
Text Solution
|
- Range of the data "18, 24, 15, 17, 33, 16, 29, 45, 12, 3, 33, 21" is
Text Solution
|
- 0- 10, 11- 20, 21 - 30, 31 -40. The real lower limit of the class 21 -...
Text Solution
|
- In the above problem a5=…
Text Solution
|
- The temperatures of a city recorded during a week are 42^@ , 35^@ , 44...
Text Solution
|
- In a deviation problem sumfidi=-12 and A=15, sumf=20, then barx=
Text Solution
|
- Median of 3, 7, 4, 6 and 12 is
Text Solution
|
- Median of the data 5, 8, 9, x, 11, 13 is 9.5 (given that data is arran...
Text Solution
|
- Formula to find mean for a grouped data is
Text Solution
|
- Mode of the data 3, 7, 8, 8, 7, 6, 8, 4, 3, 11 is
Text Solution
|