A
B
C
D
Text Solution
Verified by Experts


Topper's Solved these Questions
Similar Questions
Explore conceptually related problems
UNITED BOOK HOUSE-BEHAVIOUS OF GASES-EXAMPLE
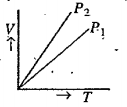
- V versus T curves at constant pressure P1 and P2 for an ideal gas are ...
Text Solution
|
- What is the value of normal temperature?
Text Solution
|
- What is the relation between pressure and density of a gas at constant...
Text Solution
|
- In which instrument pressure can be measured?
Text Solution
|
- What is the value of absolute zero temp in fahrenheit scale?
Text Solution
|
- What is the relation between kelvih scale and Celsius scale?
Text Solution
|
- What is the value of melting point of ice in kelvin scale?
Text Solution
|
- What is the value of Avogadro’s number?
Text Solution
|
- What is torr?
Text Solution
|
- What is the full form of SATP.
Text Solution
|
- What is the value of bar in dyne//cm^2 unit.
Text Solution
|
- Under what conditions is Boyle’s law is applicable?
Text Solution
|
- What is the value of gas constant in S.L units?
Text Solution
|
- Which is greater 30^C or 300 K?
Text Solution
|
- What are the constants of Boyle’s law?
Text Solution
|
- A gas.initially at 0^@C is heated so that its pressure and.volume are ...
Text Solution
|
- All gases known so far are ideal gases.
Text Solution
|
- No deviation from avogadros law is observed in case of real gases.
Text Solution
|
- The universal gas constent depends upon the nature of the gas.
Text Solution
|
- The value of avagadros number is 6.022xx10^(23).
Text Solution
|