A
B
C
D
Text Solution
Verified by Experts
The correct Answer is:


Similar Questions
Explore conceptually related problems
Recommended Questions
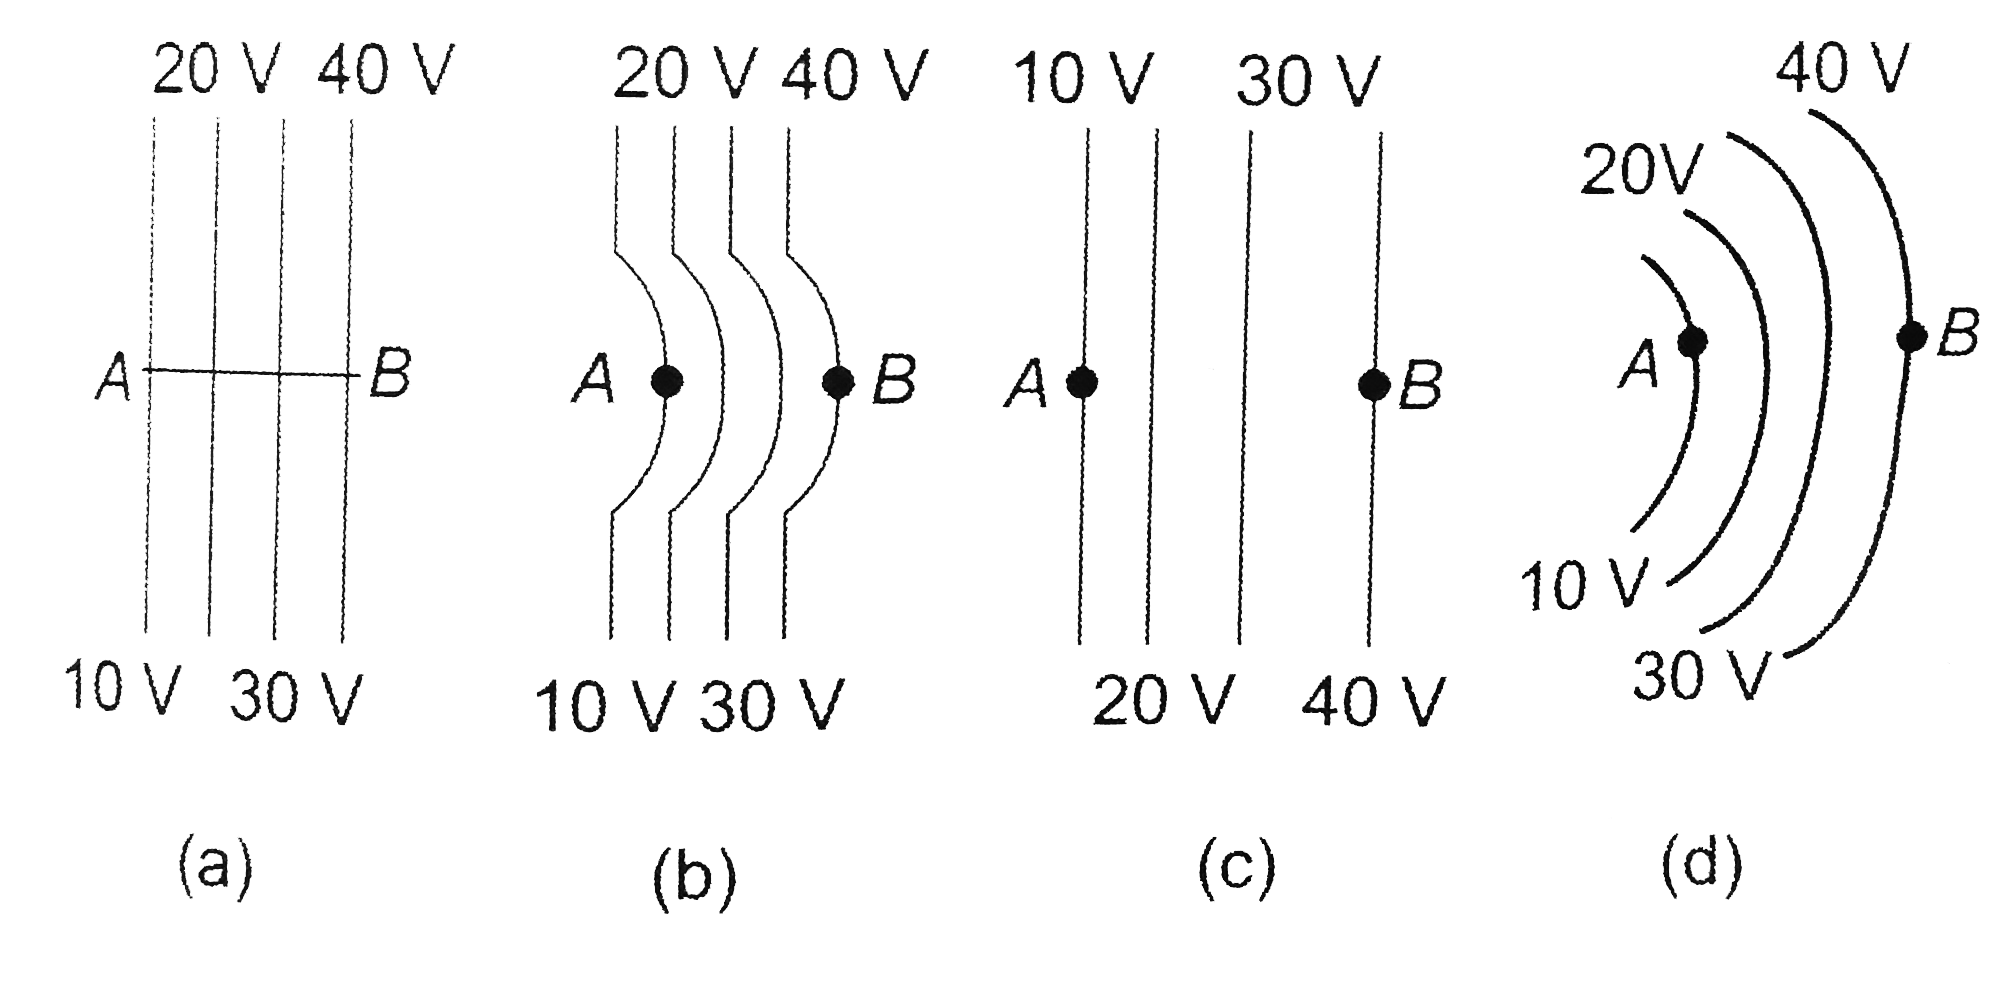
- The diagram below show regions of equipotential: A positive charge i...
Text Solution
|
- The diagram below show regions of equipotential: A positive chrages ...
Text Solution
|
- The diagrams below show region of equipotentials.
Text Solution
|
- The diagram below show region of equipotentials. A positive charge is ...
Text Solution
|
- यहाँ आरेख में कुछ समविभव क्षेत्र दर्शाये गए है : प्रत्येक आरेख एक...
Text Solution
|
- The diagram below show regions of equipotentials. A positive charge is...
Text Solution
|
- संलग्न चित्र में एक गैस का P-V आरेख दिखाया गया है। बिन्दु A की स्थित...
Text Solution
|
- The diagrams below show regions of equipotentials. A positve charge is...
Text Solution
|
- What is meant by equipotential surface? Show that the amount of work d...
Text Solution
|